Skip to content
exeTrace
Traceability system for manufacturing

Analyze your production data before your customer does.

exeTrace collects process data from your PLCs and turns it into FPY, defect Pareto, SPC charts and shift comparison. And when a complaint arrives, the history of every unit is already recorded.

Deployed by your own maintenance team in 1–3 working days.

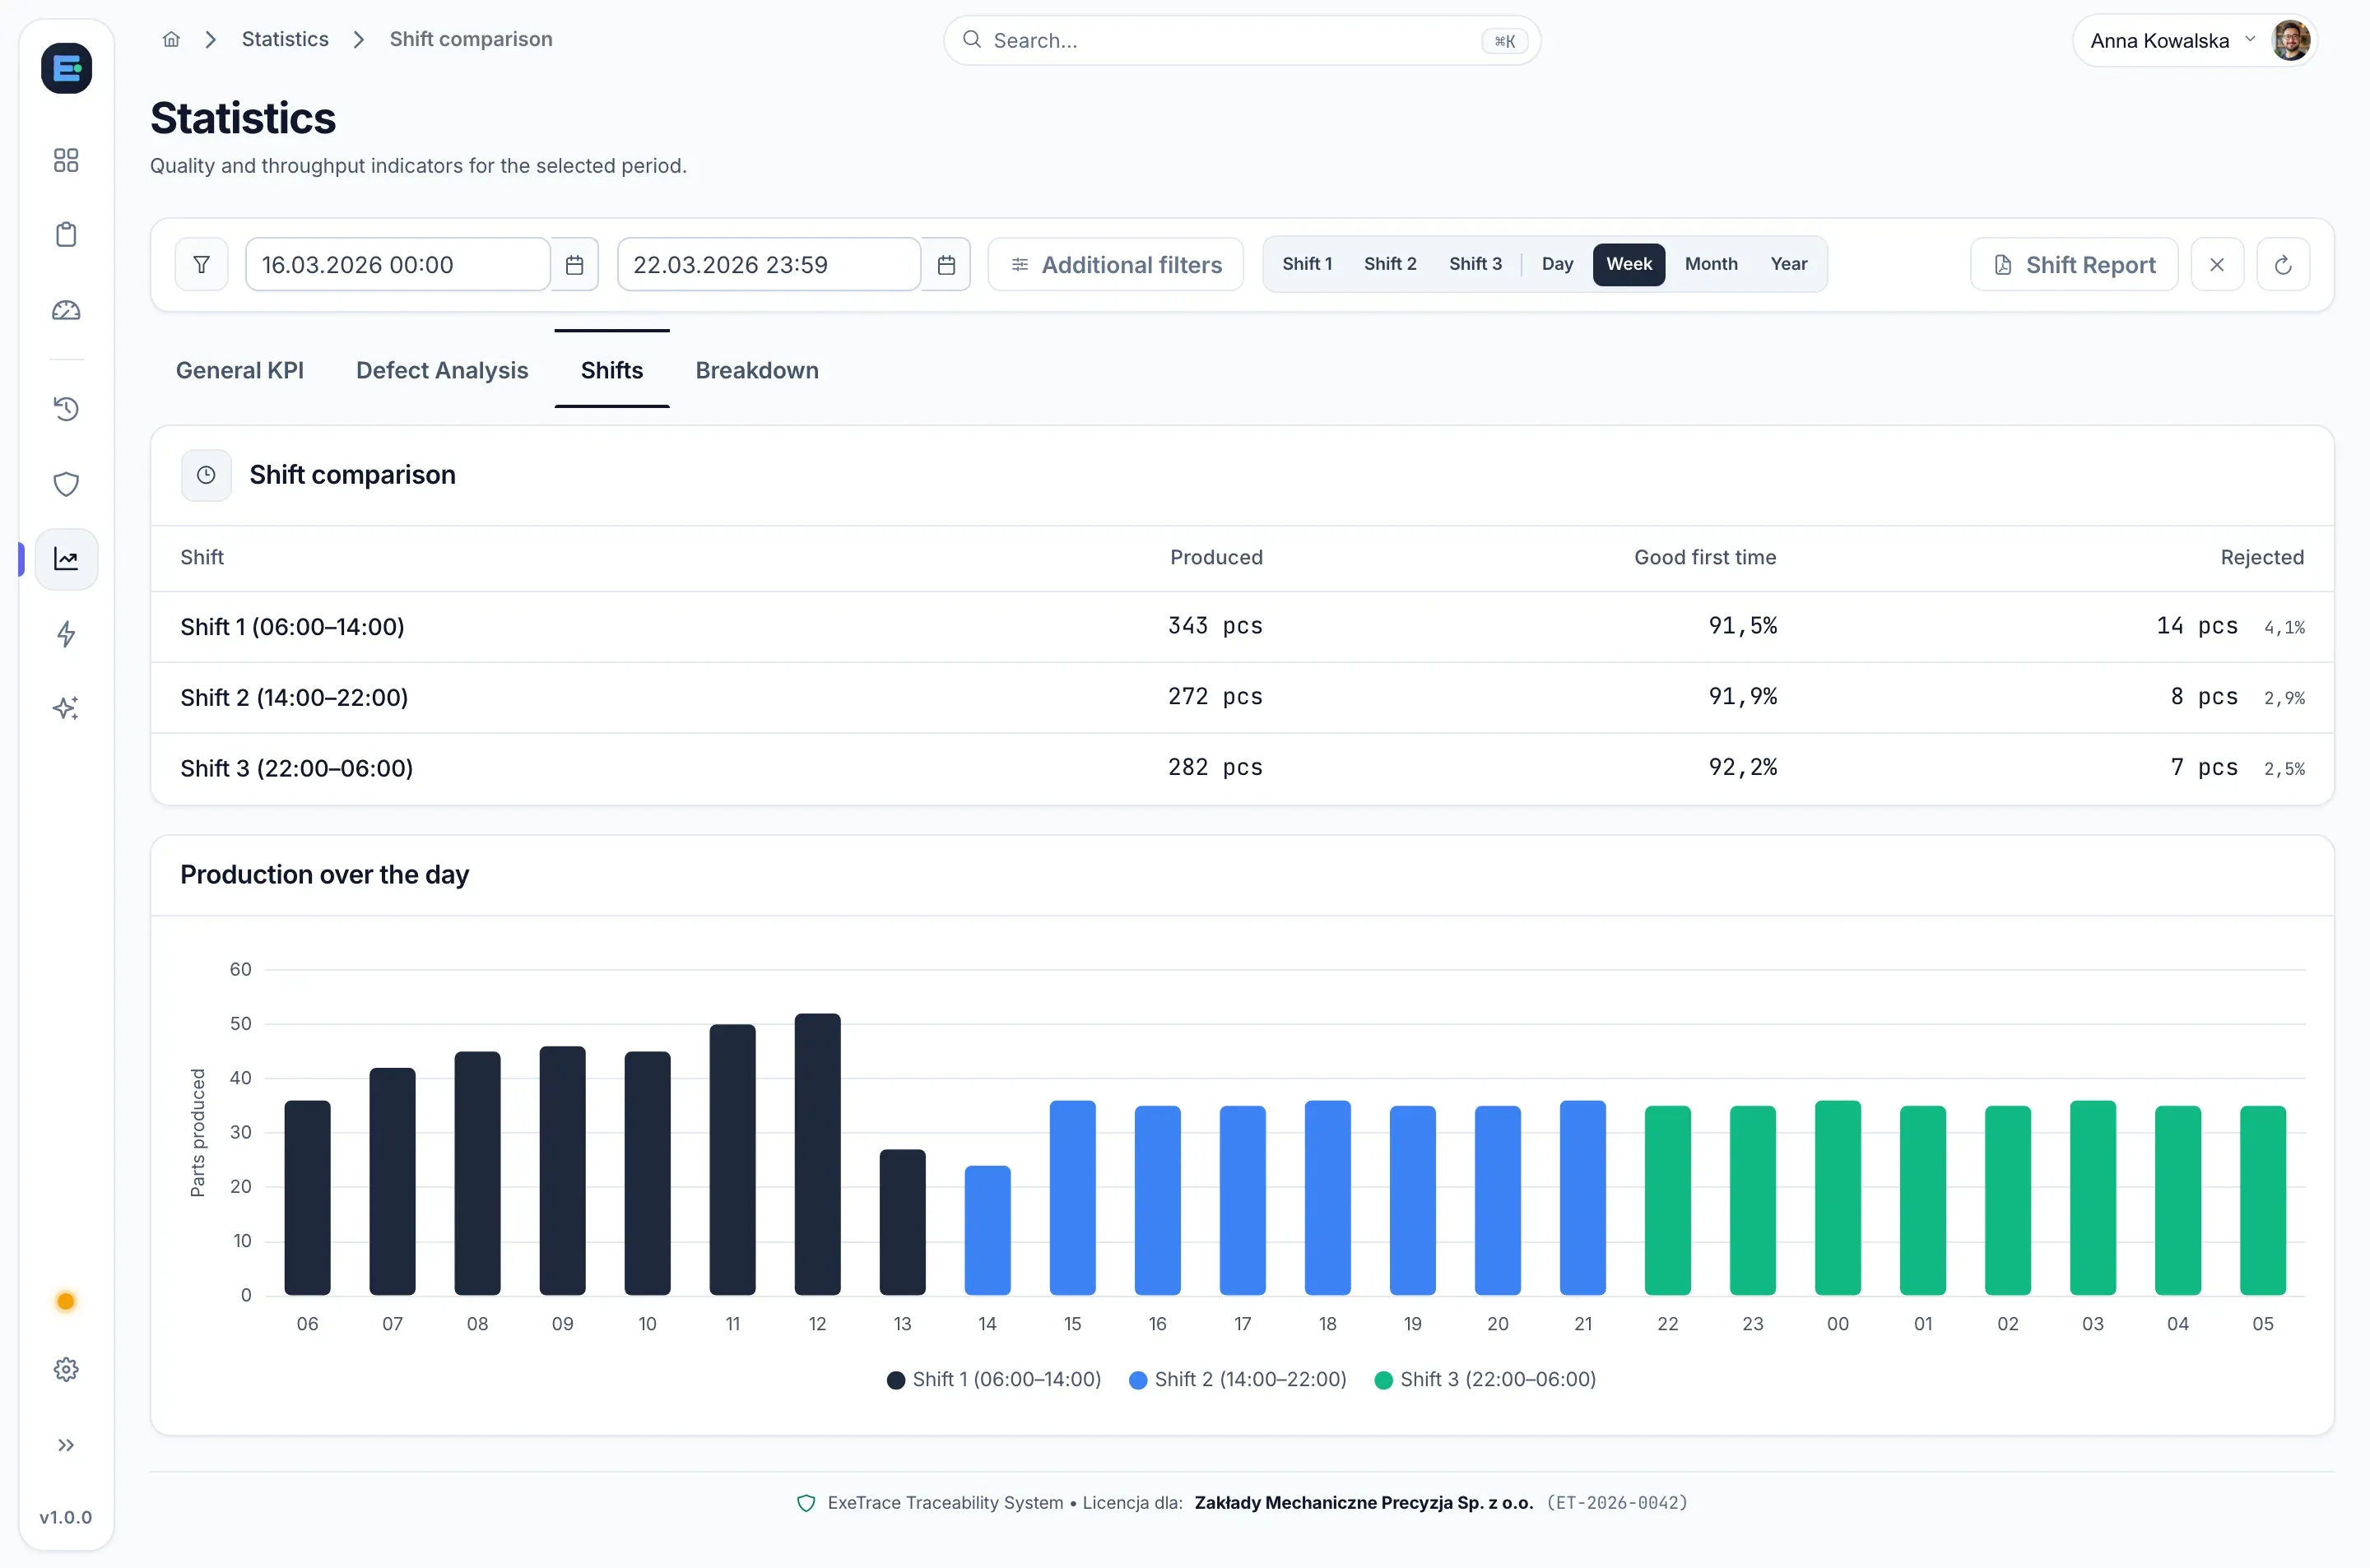
The statistics screen in exeTrace: a comparison of three shifts (units produced, first-pass good rate, rejected) and a chart of output over the day, with a Shift report button
Enlarge view
92.2% first-pass good on shift 3 — shifts compared side by side
Shift report PDF summary in one click
  • On-premise data stays on your network
  • Siemens S7-300/1200/1500 ready-to-import blocks
  • 1–3 working days to first data
  • Public pricing perpetual licence
  • PL · EN · DE dashboard interface in three languages
Data from the shop floor

The data is in your machines. What’s missing is one place to see it.

PLCs record everything — but the data stays in machines, spreadsheets and operators’ heads.

Scattered data
  1. 1 Parameters stay in the PLCs, test results in spreadsheets, and shift reports are built by hand.
  2. 2 You do not know which station scraps the most, or whether a process is starting to drift.
  3. 3 When a customer complains, the team spends days hunting for the cause — and quarantines the whole batch.
With exeTrace
  1. 1 Data from every station flows automatically into one database and one dashboard.
  2. 2 FPY, defect Pareto, SPC charts and shift comparison calculate themselves, live.
  3. 3 Complaint? A serial number opens the unit’s history — you recall only the units at risk, not the batch.
The dashboard in practice

Seven screens, seven answers.

Each screen answers a question you already ask at work — no Excel exports and no chasing other departments for data.

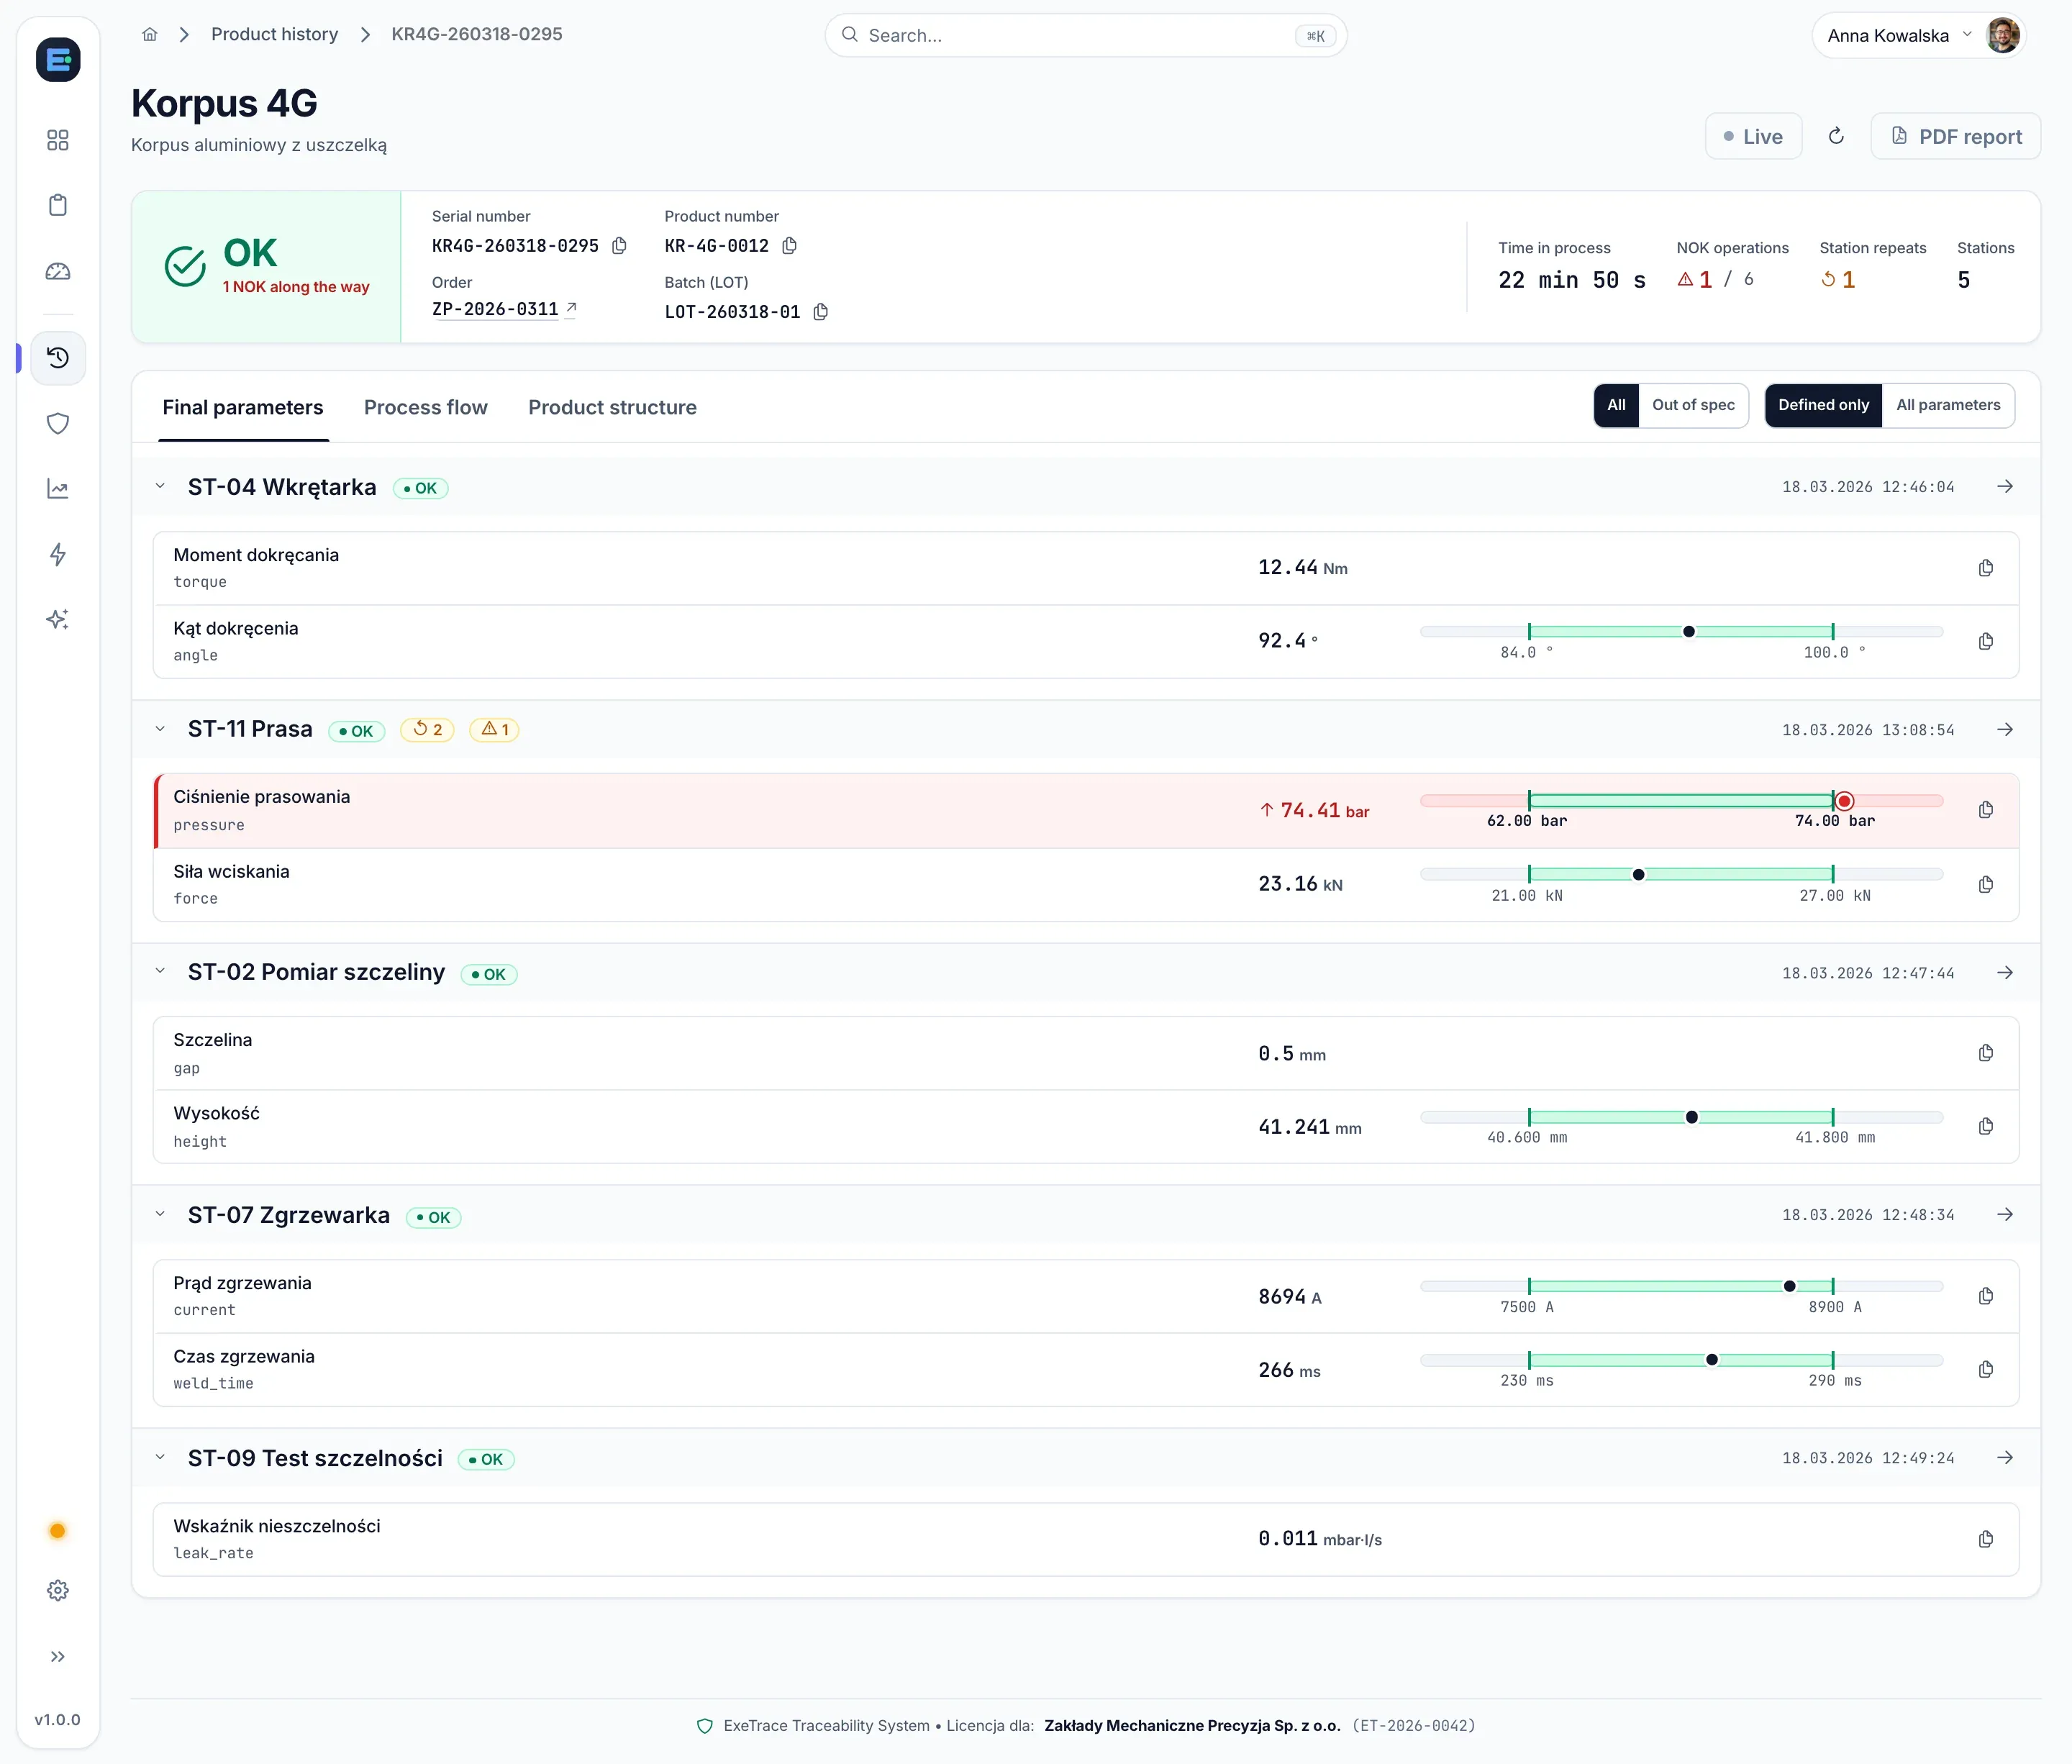
01 Unit passport

Customer complaint? You have the answer in a minute.

Serial number, order, lot and the results of every station on one screen. Out-of-tolerance values light up in red, and you download the customer proof as a PDF.

  • Serial number, order, lot (LOT) and product number in the header
  • Every parameter on a tolerance bar, out-of-range values in red
  • PDF report in one click
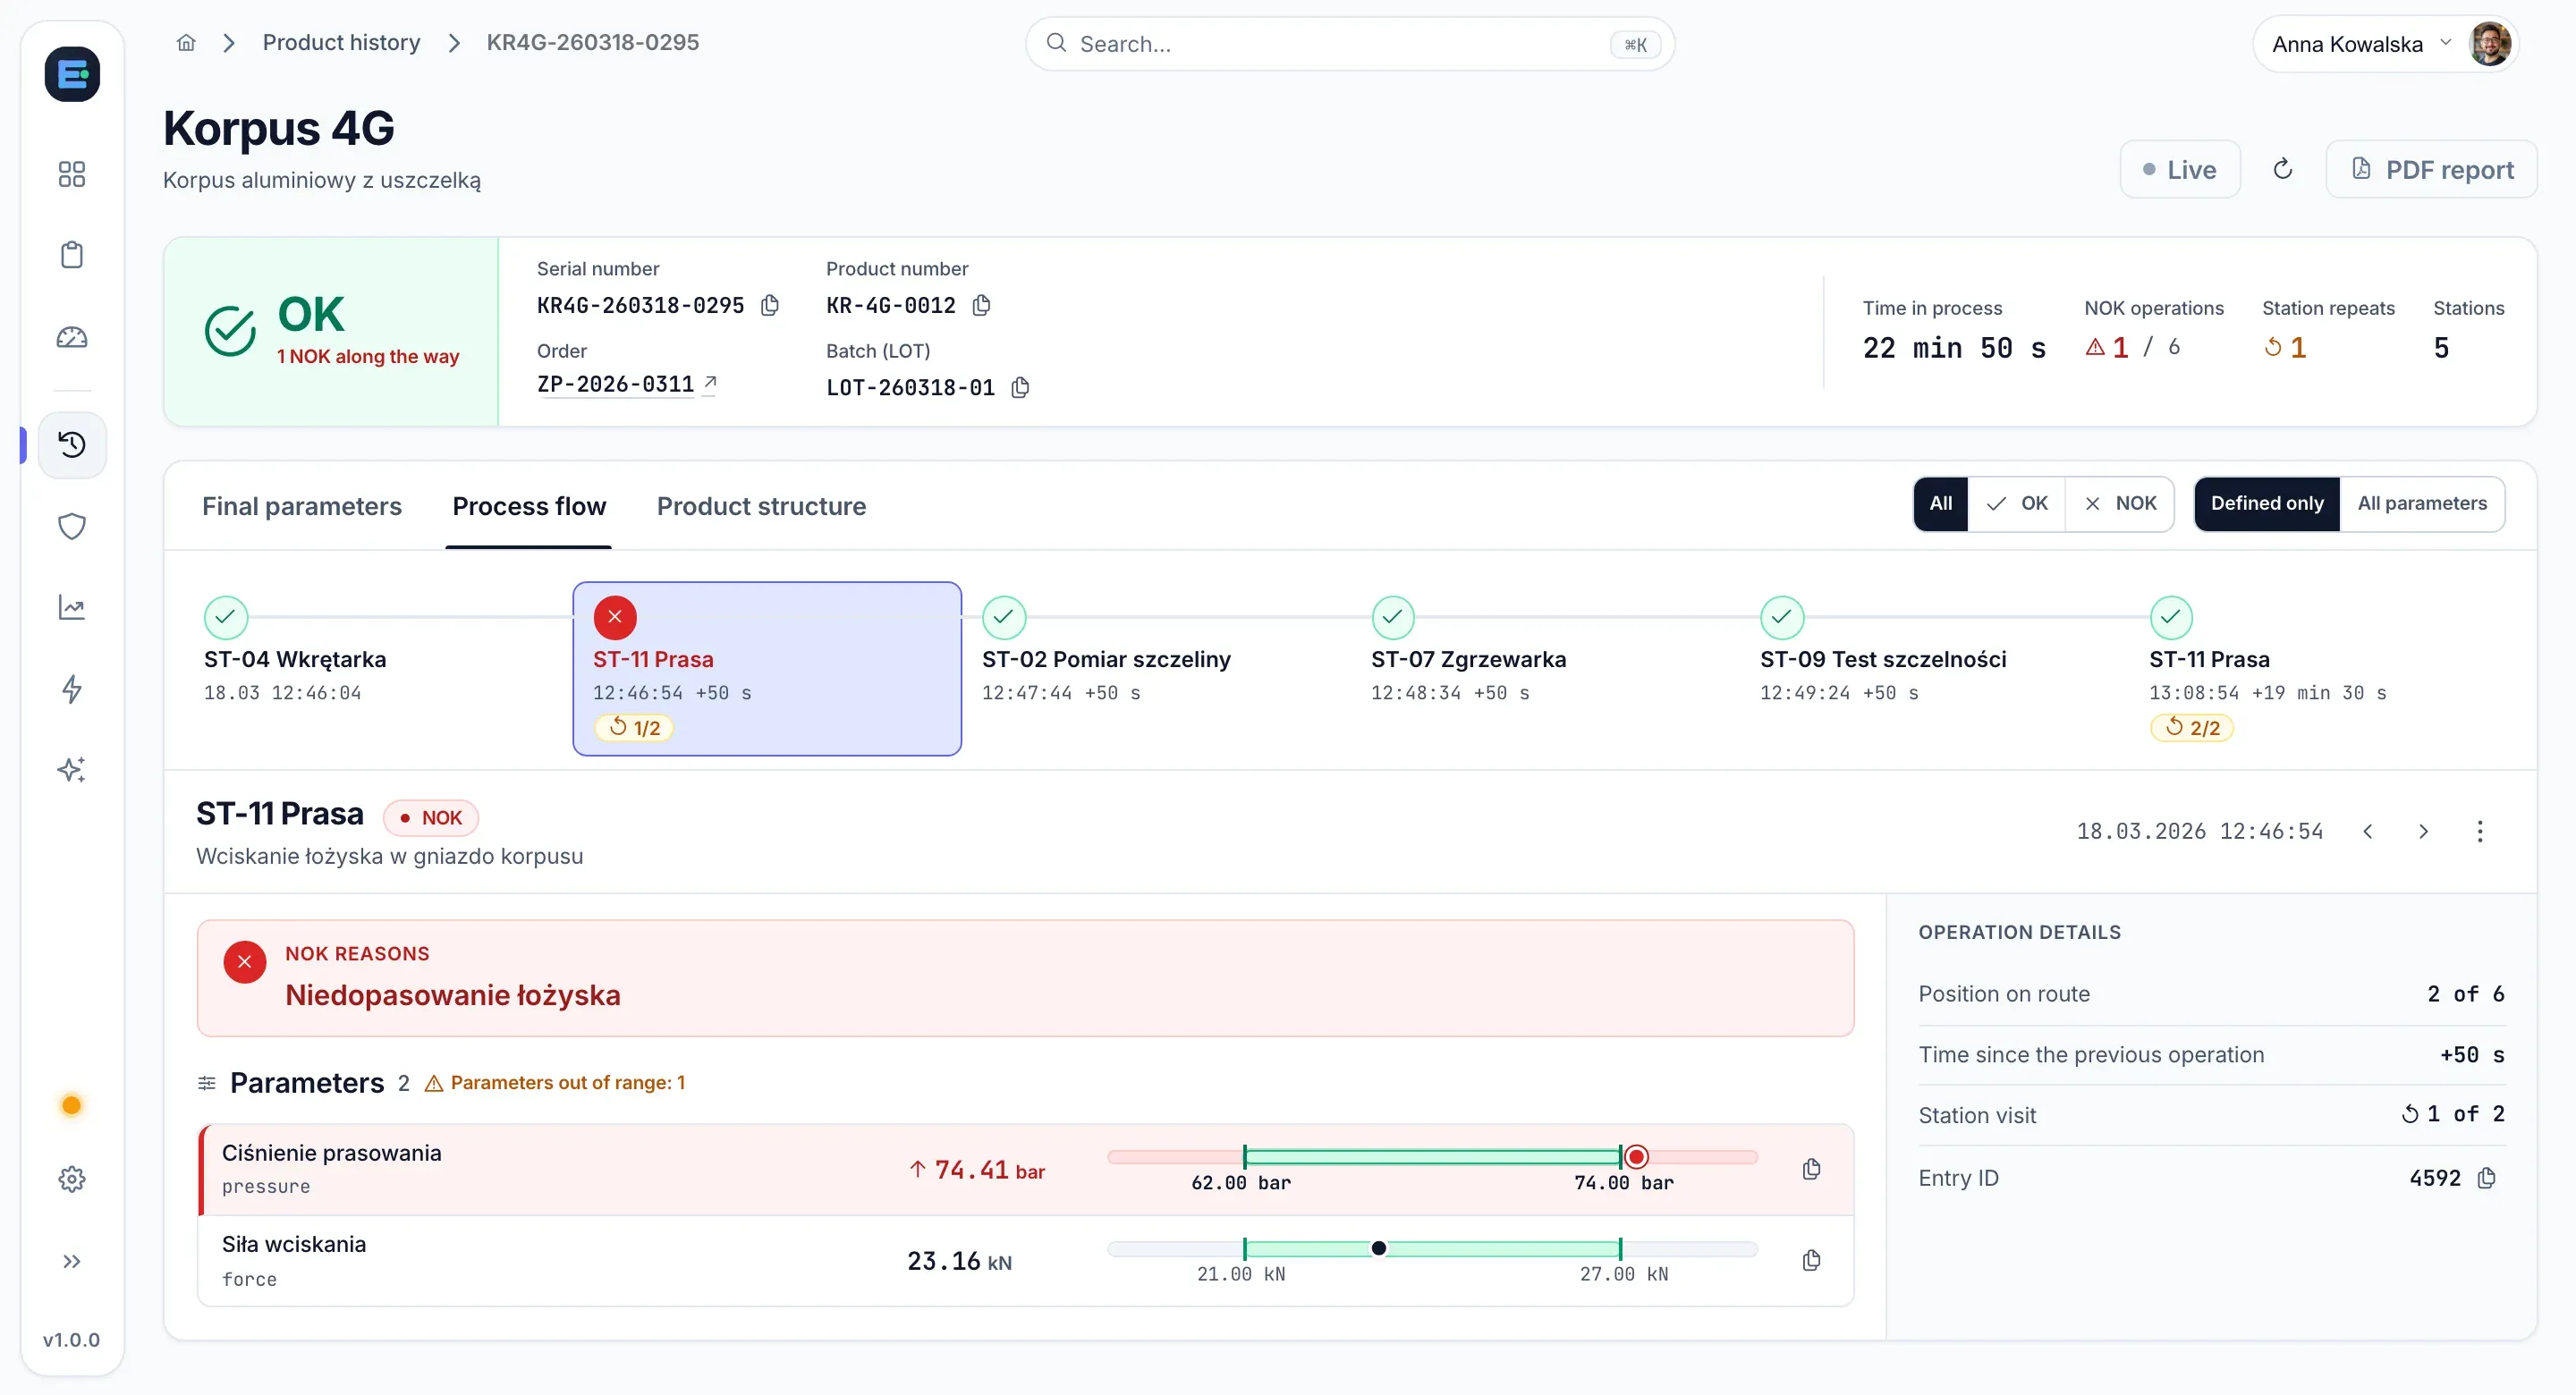
02 Unit route

You know which units only passed on the second attempt.

The timeline shows every station, every repeat and the NOK cause. Rework does not hide in the result — FPY tells the truth about quality.

  • Every station with its time and the time since the previous operation
  • Station repeats (1/2, 2/2) with the NOK cause
  • Out-of-range parameter tied to a specific operation
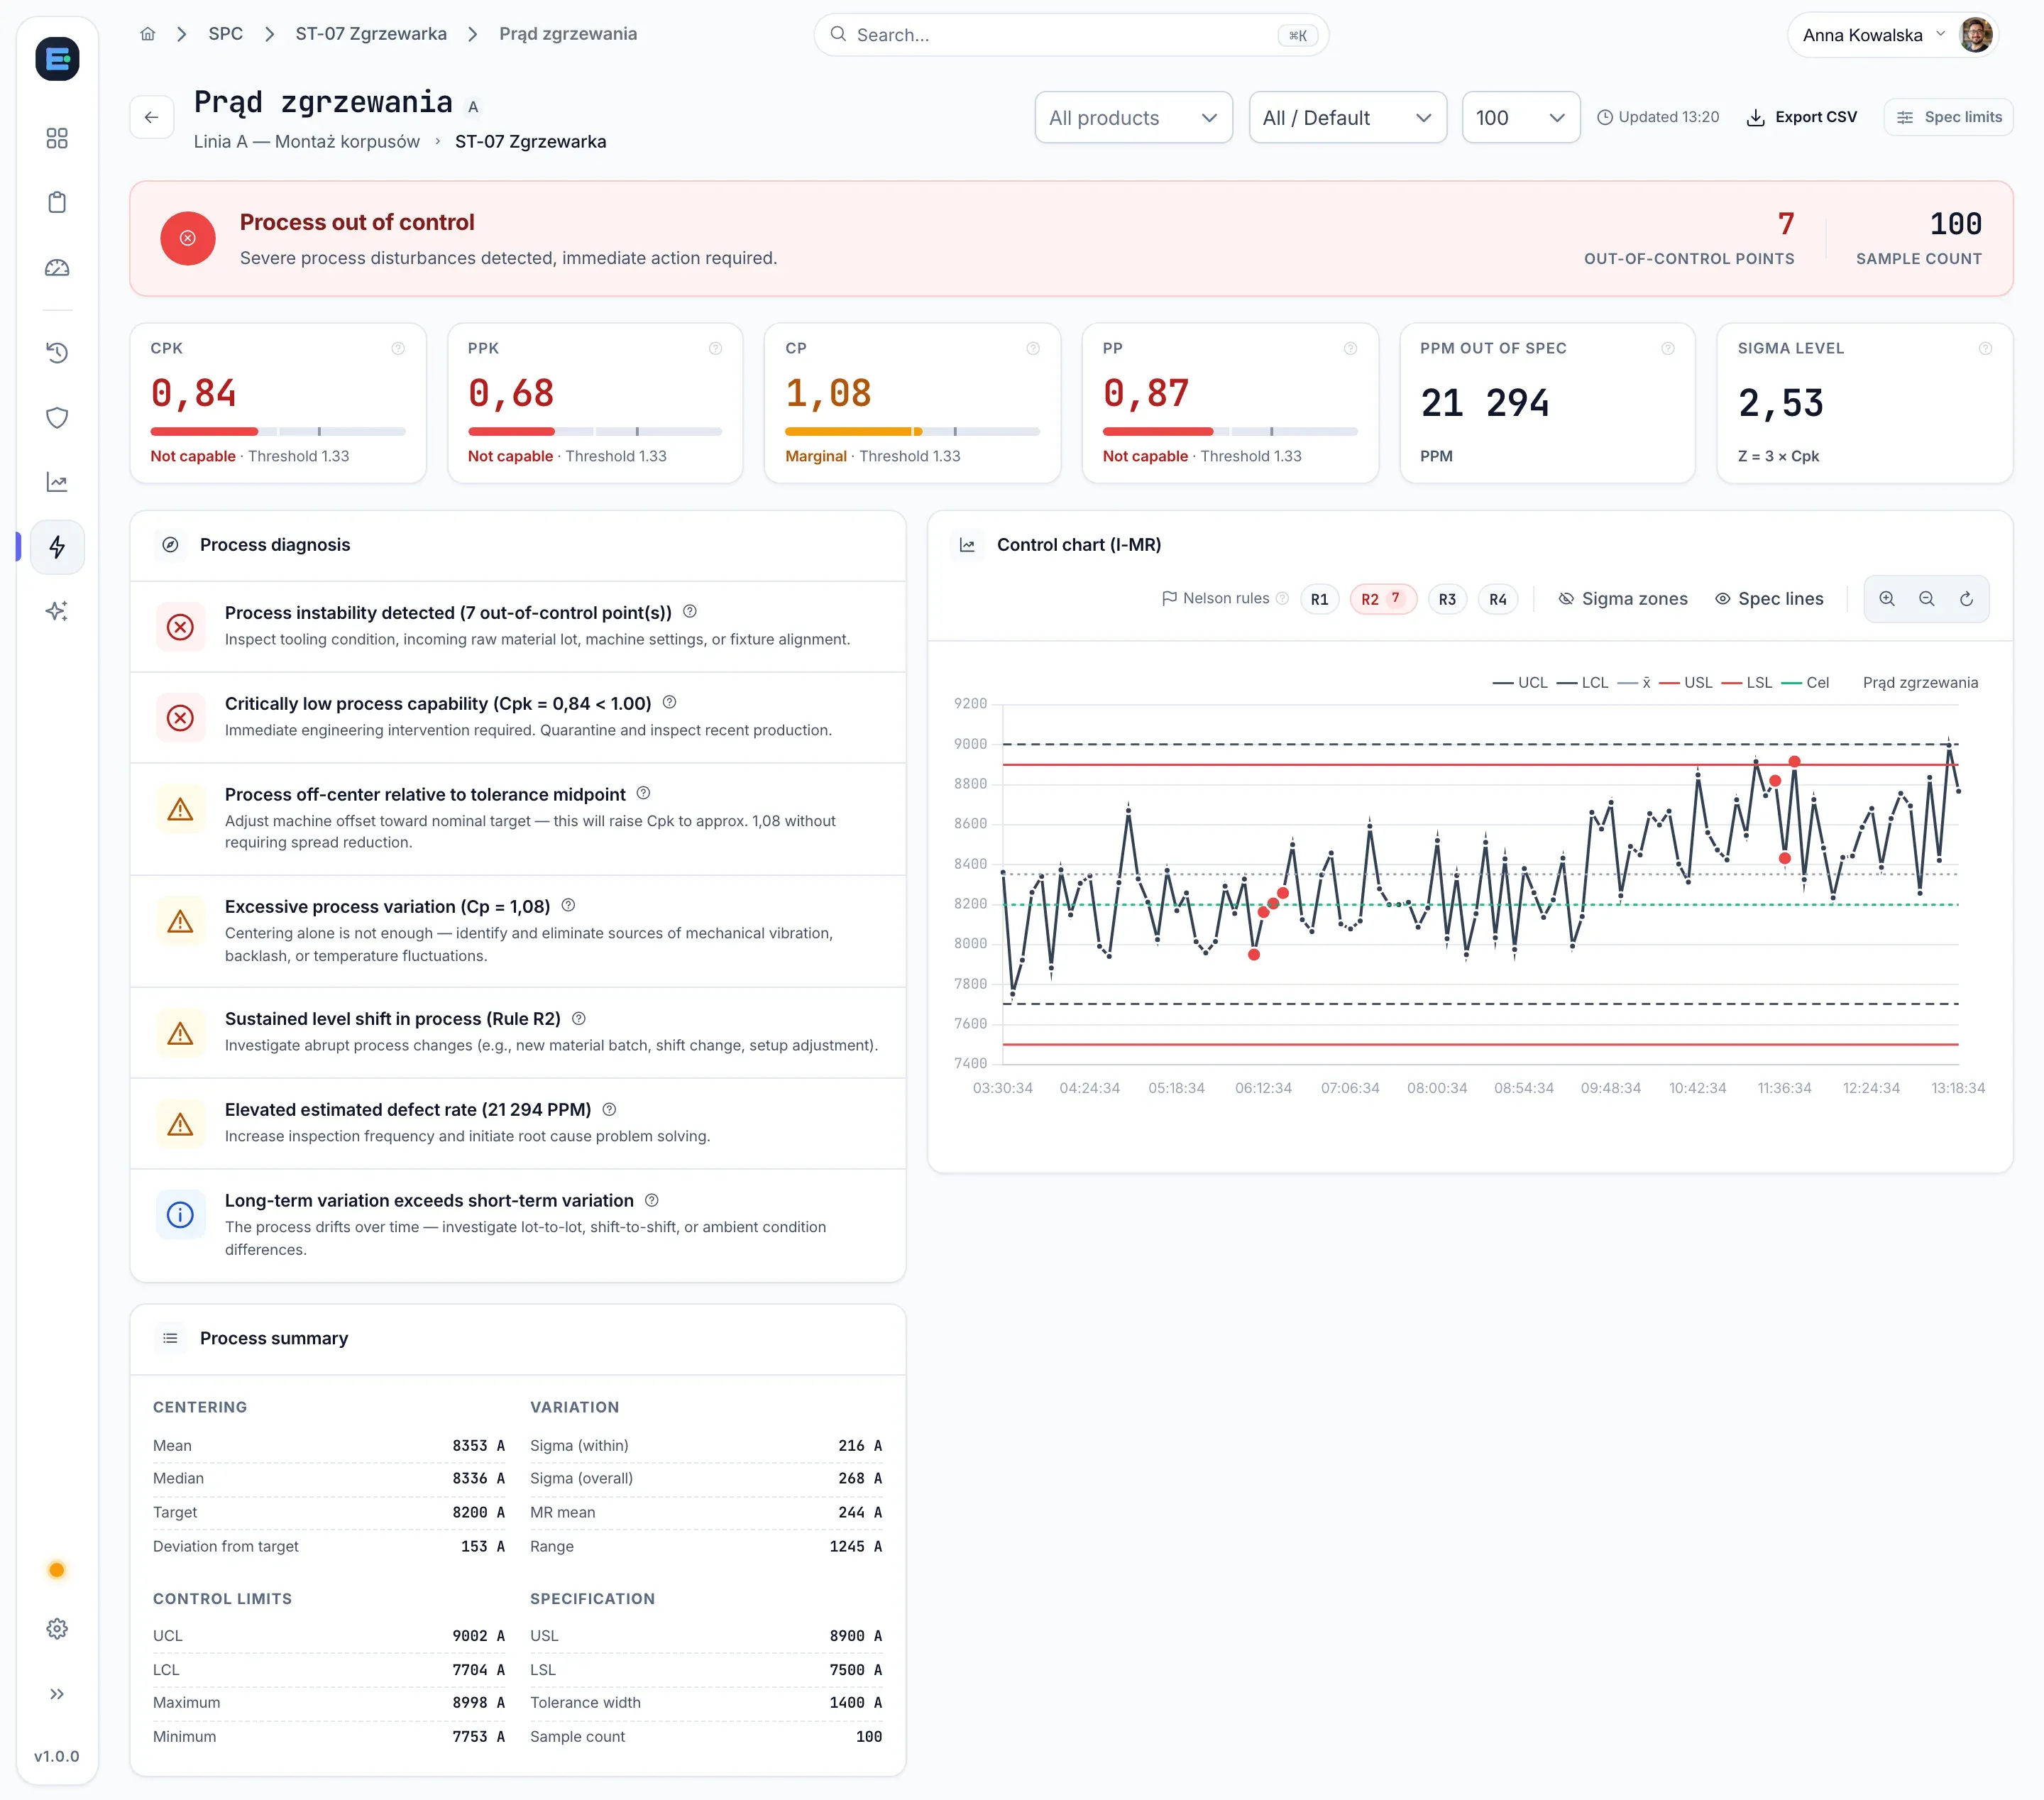
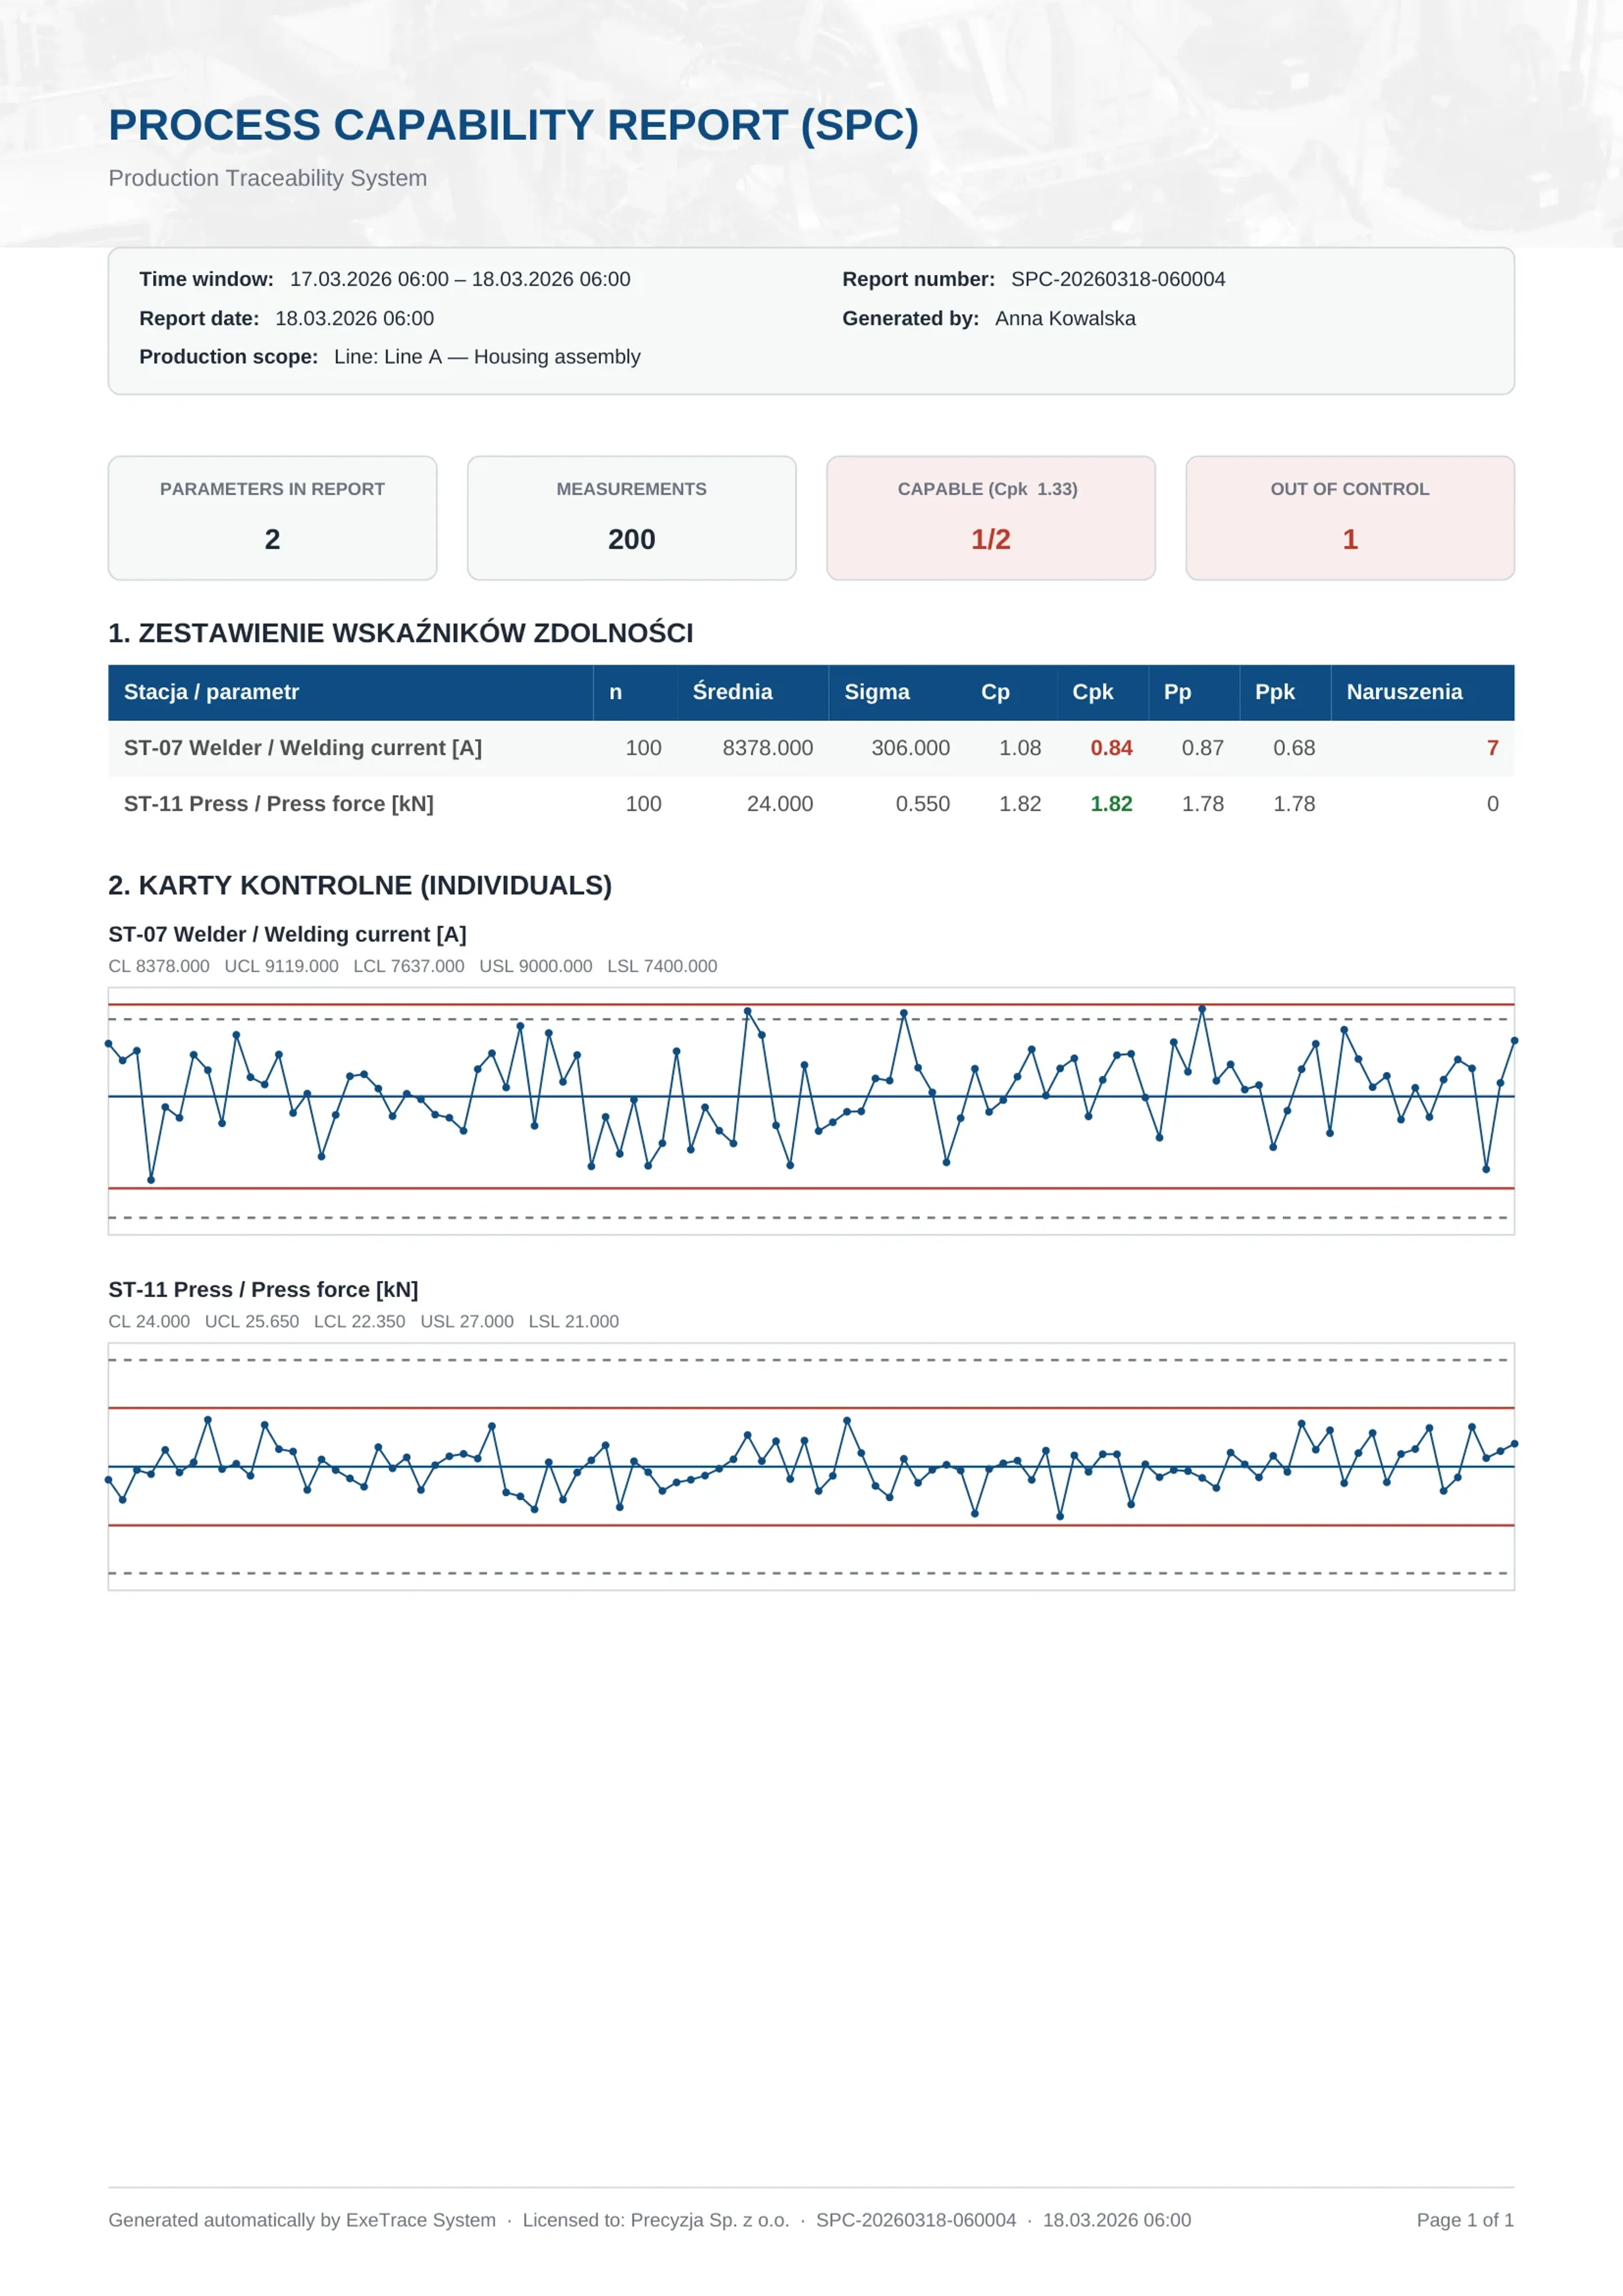
03 SPC control charts

Process drifting? You see it before the scrap shows up.

Control charts and Cp/Cpk are calculated continuously from station data. The system suggests the cause — shifted setpoint or too much spread — so you know what to adjust.

  • Cp, Cpk, Pp, Ppk, PPM and sigma level on one screen
  • Nelson rules flag out-of-control points on the I-MR chart
  • Process diagnosis with a hint on what to check
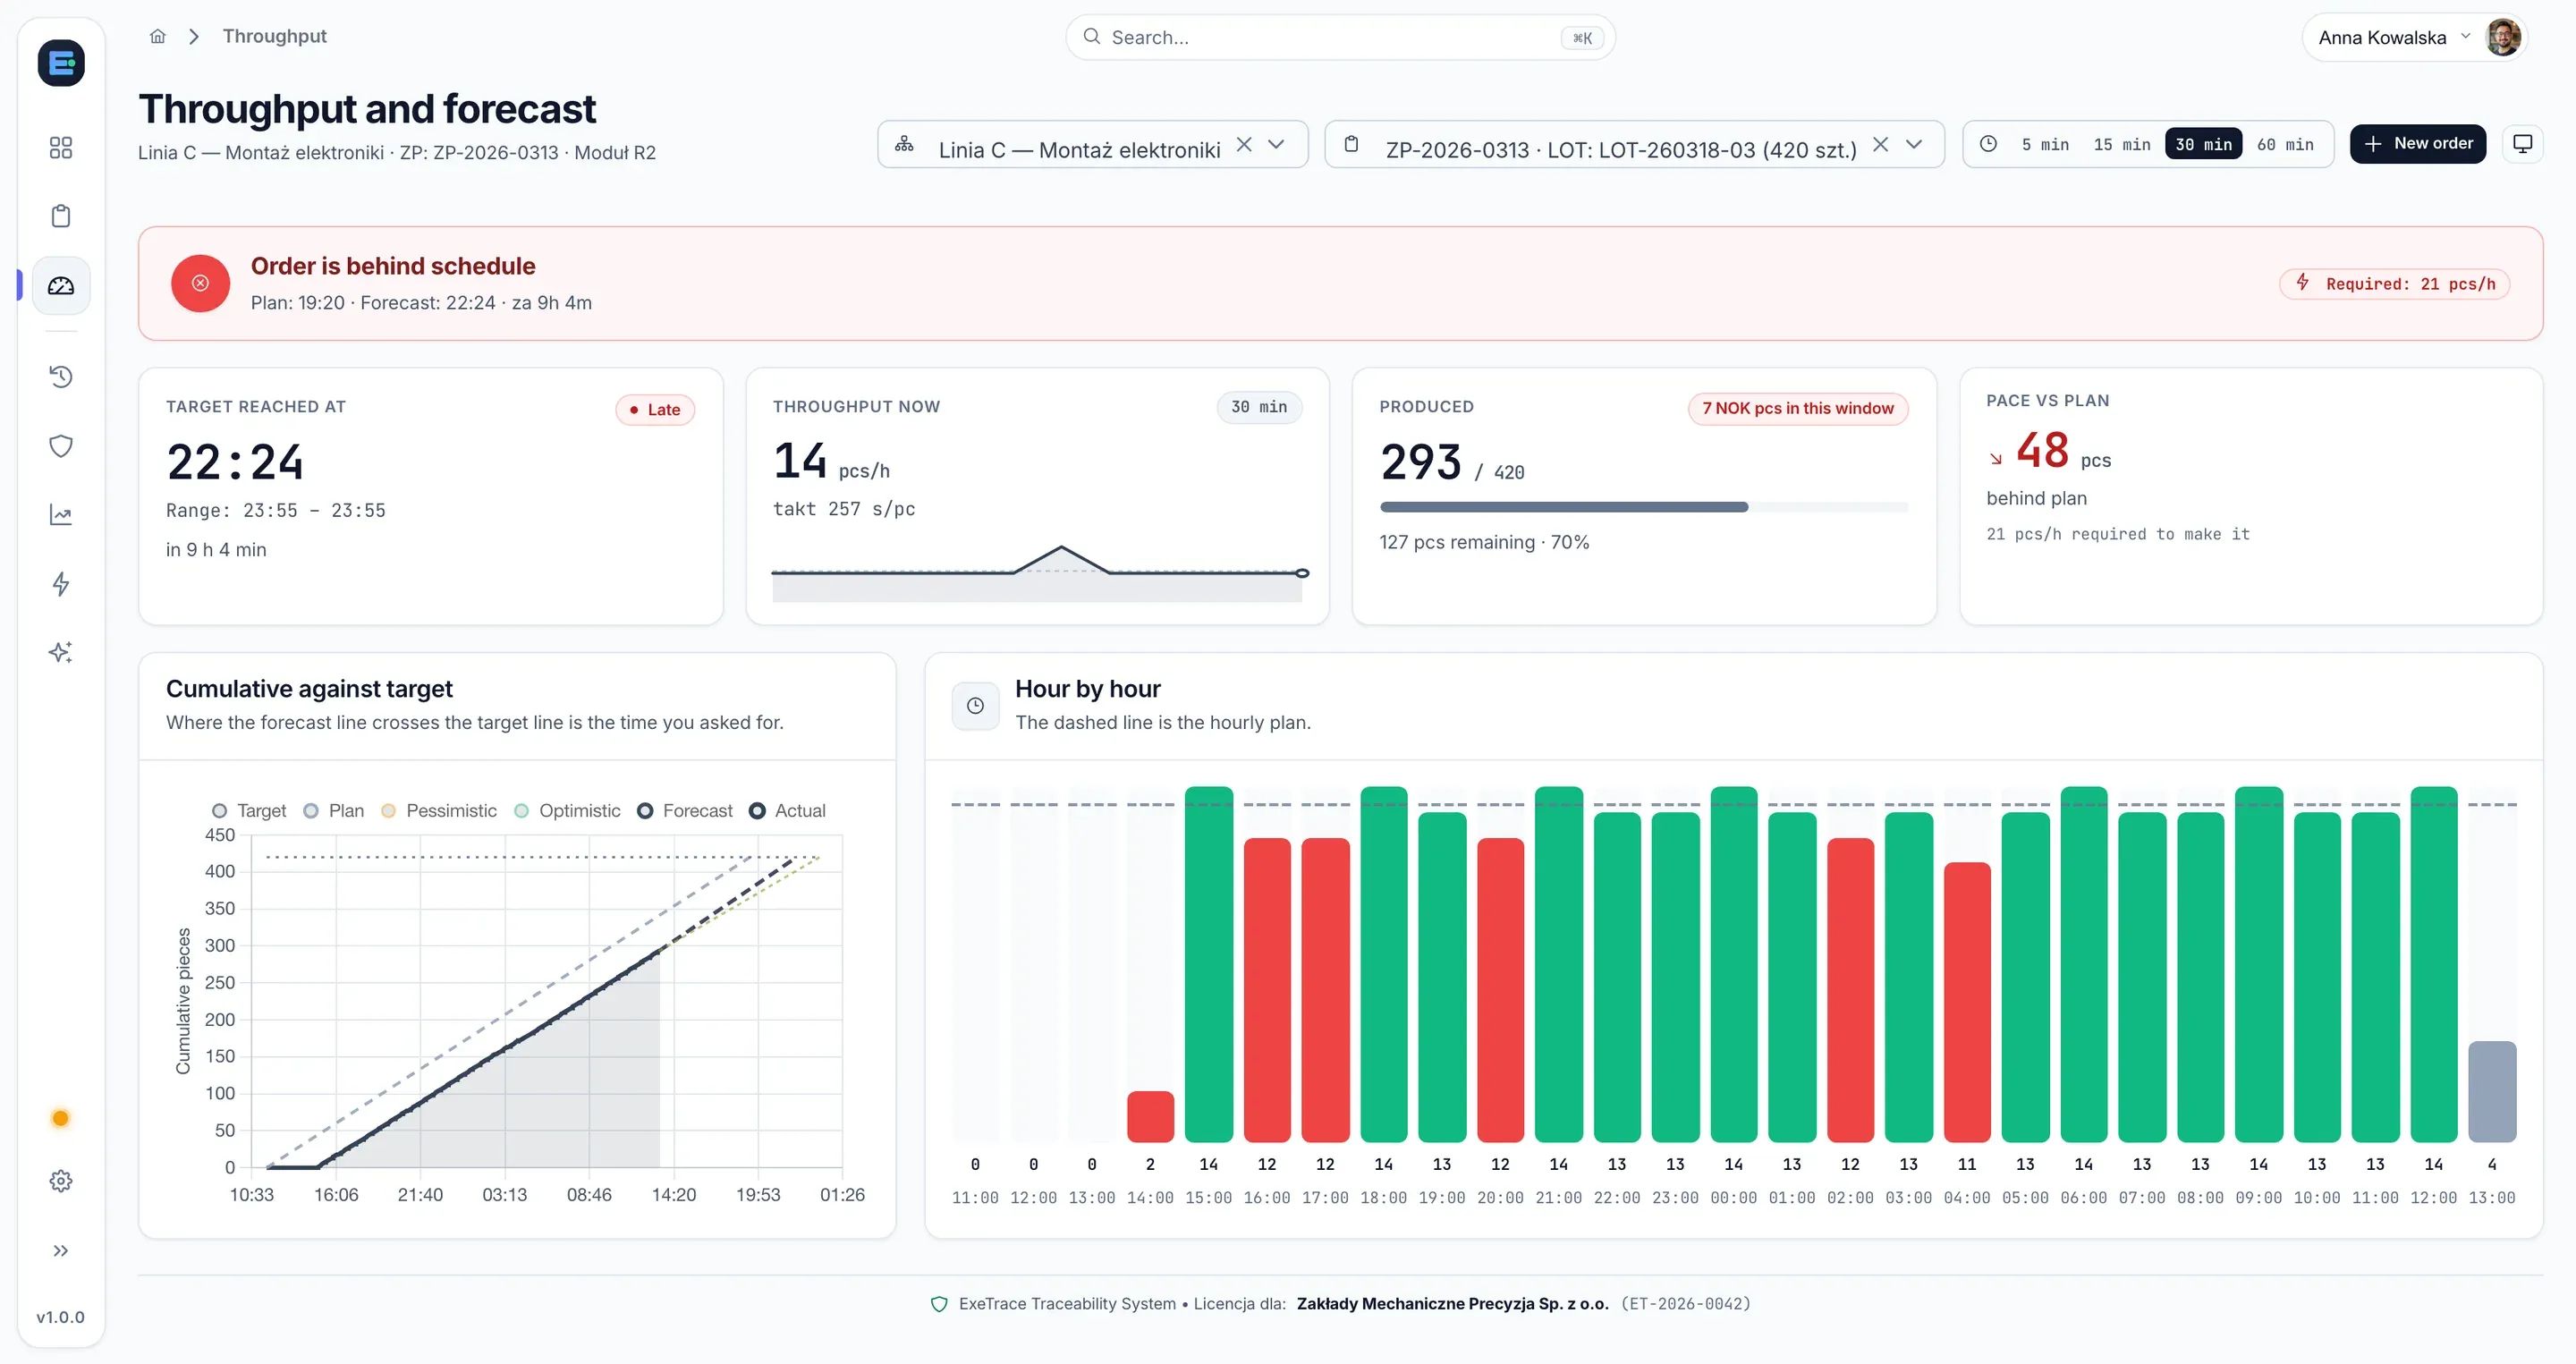
04 Throughput and forecast

You learn an order is late mid-shift, not after it.

From the live line takt the system calculates the completion time and the pace you must hold to make it. You react while you can still change something.

  • Order completion time and the delay against the plan
  • Order progress (293 of 420 pcs) and the pace needed to make it
  • Hourly output against the plan
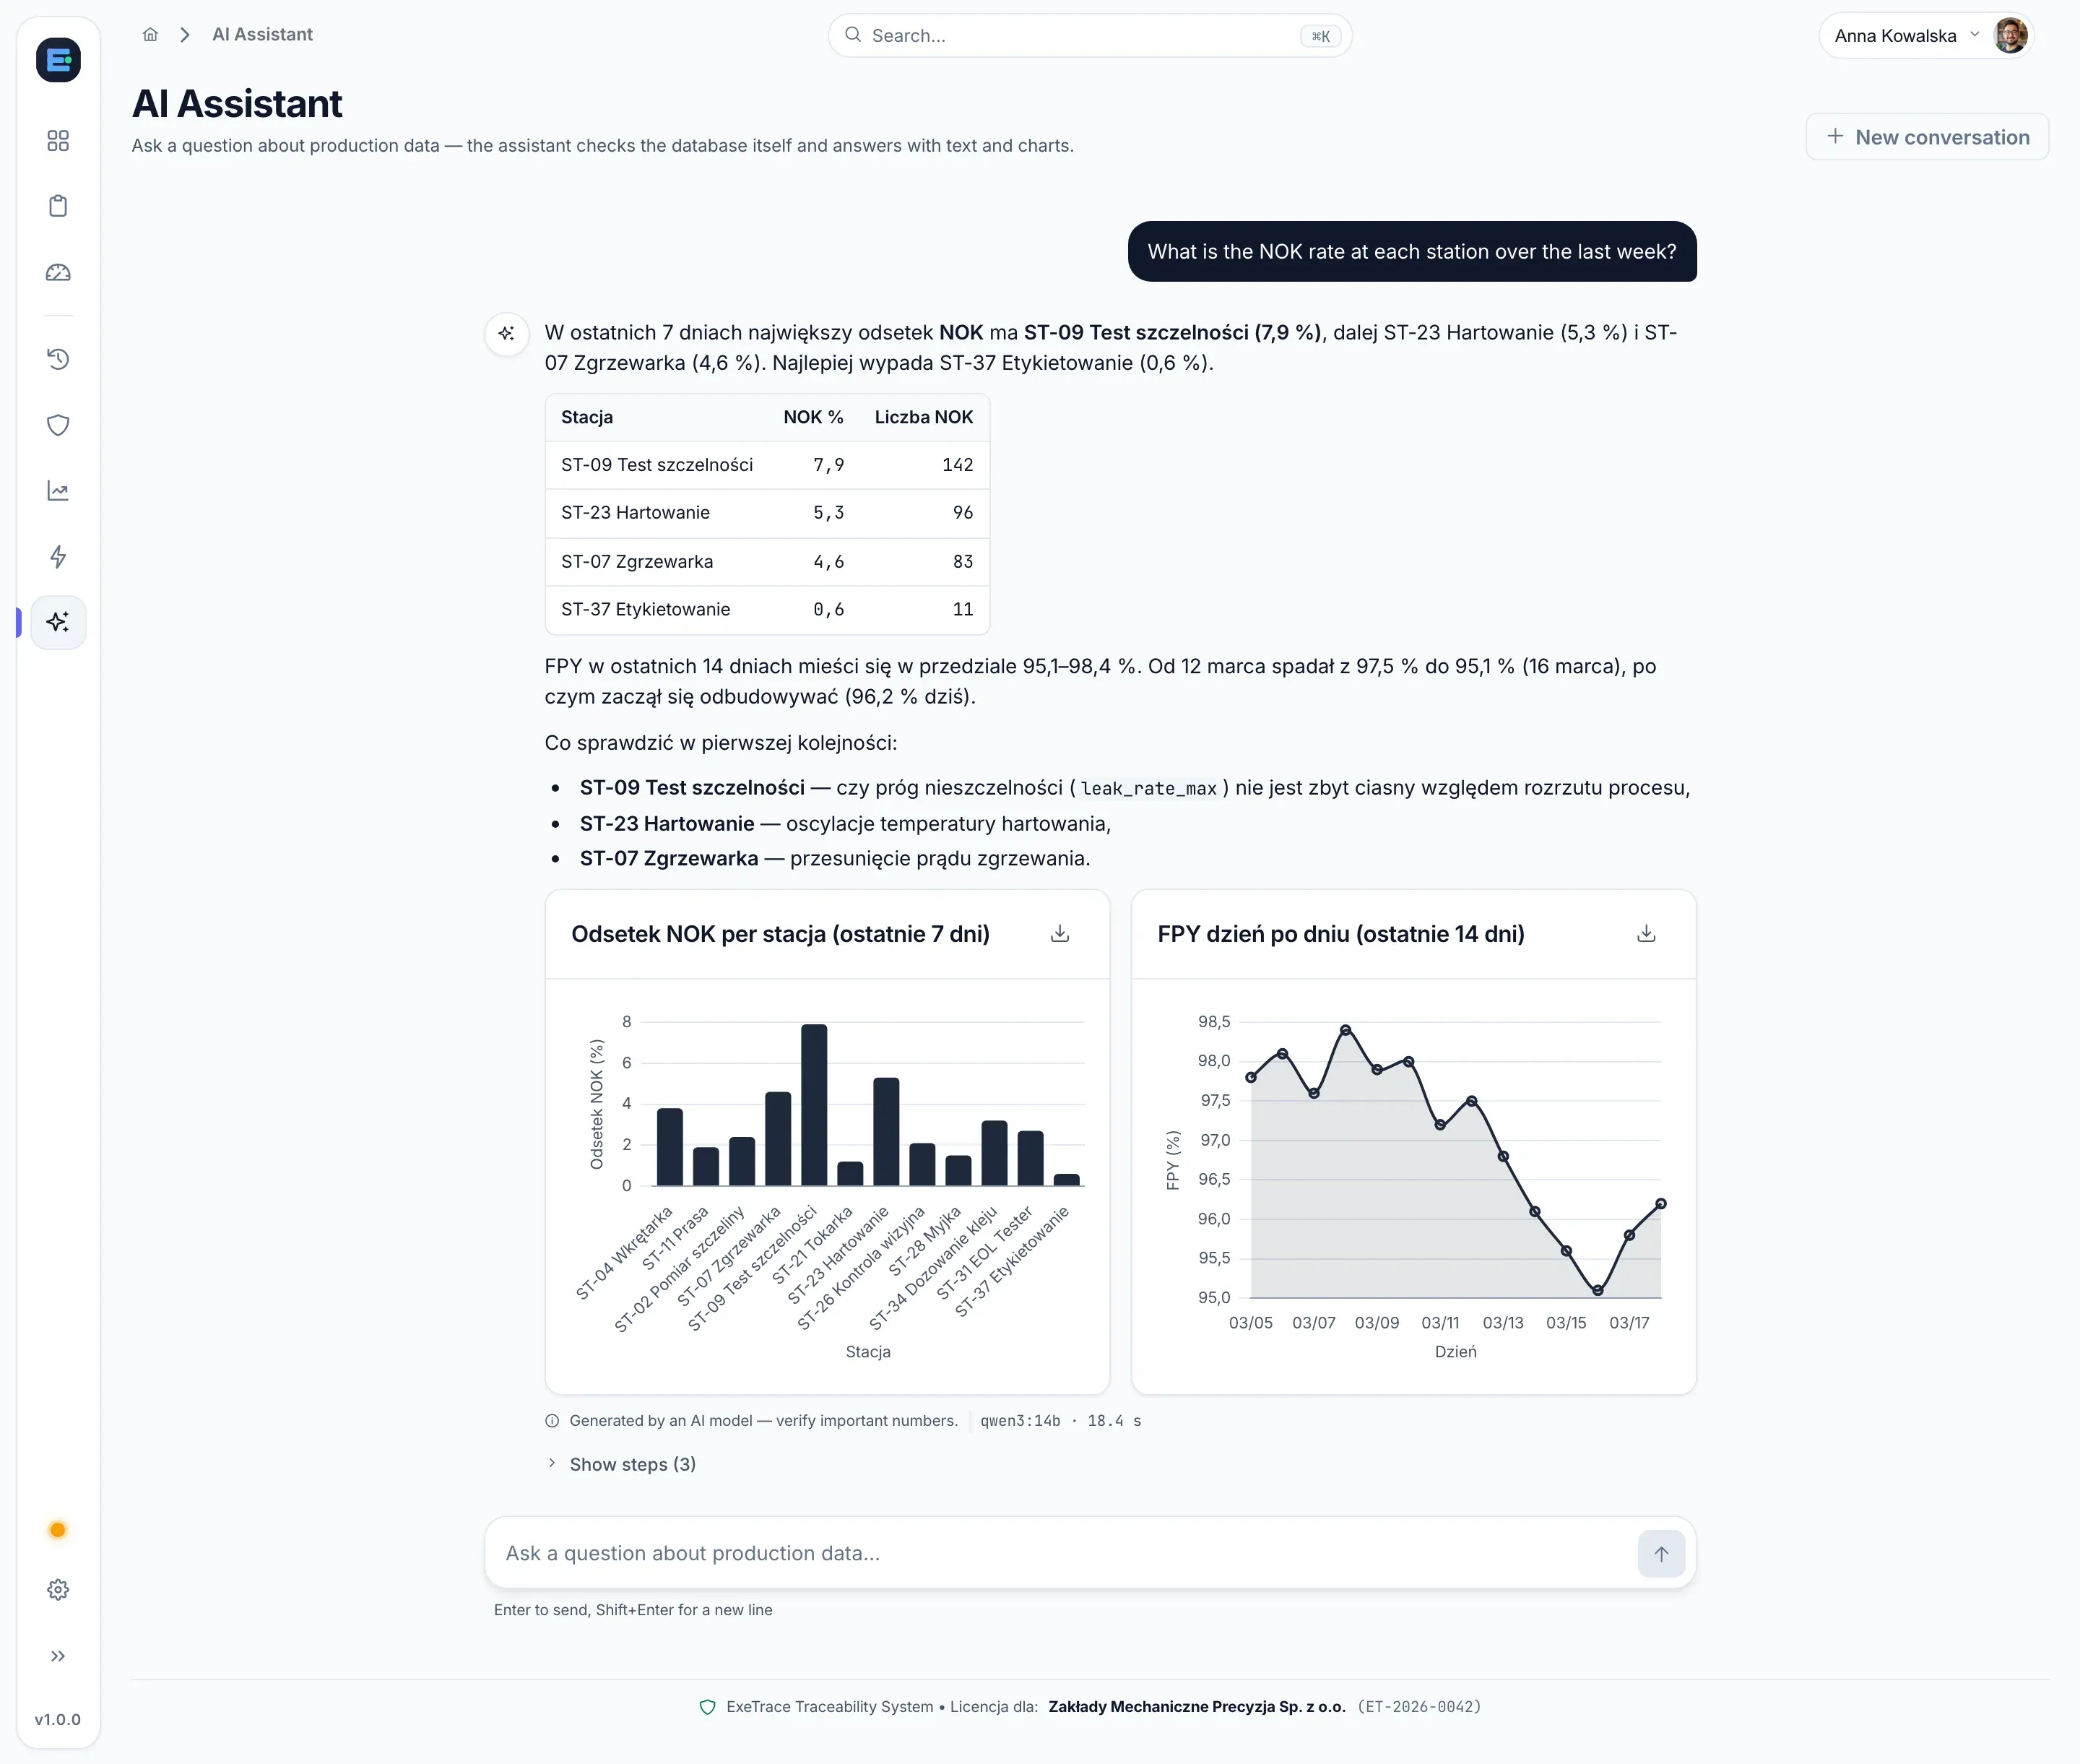
05 AI assistant

Ask in plain language. Get a chart and know where to start.

Just ask: “What is the NOK rate per station over the last week?”. The assistant runs locally and only reads data — nothing leaves your plant.

  • Plain-language answer with a list of what to check first
  • Charts created automatically, with a download option
  • FPY chart day by day for the last 14 days
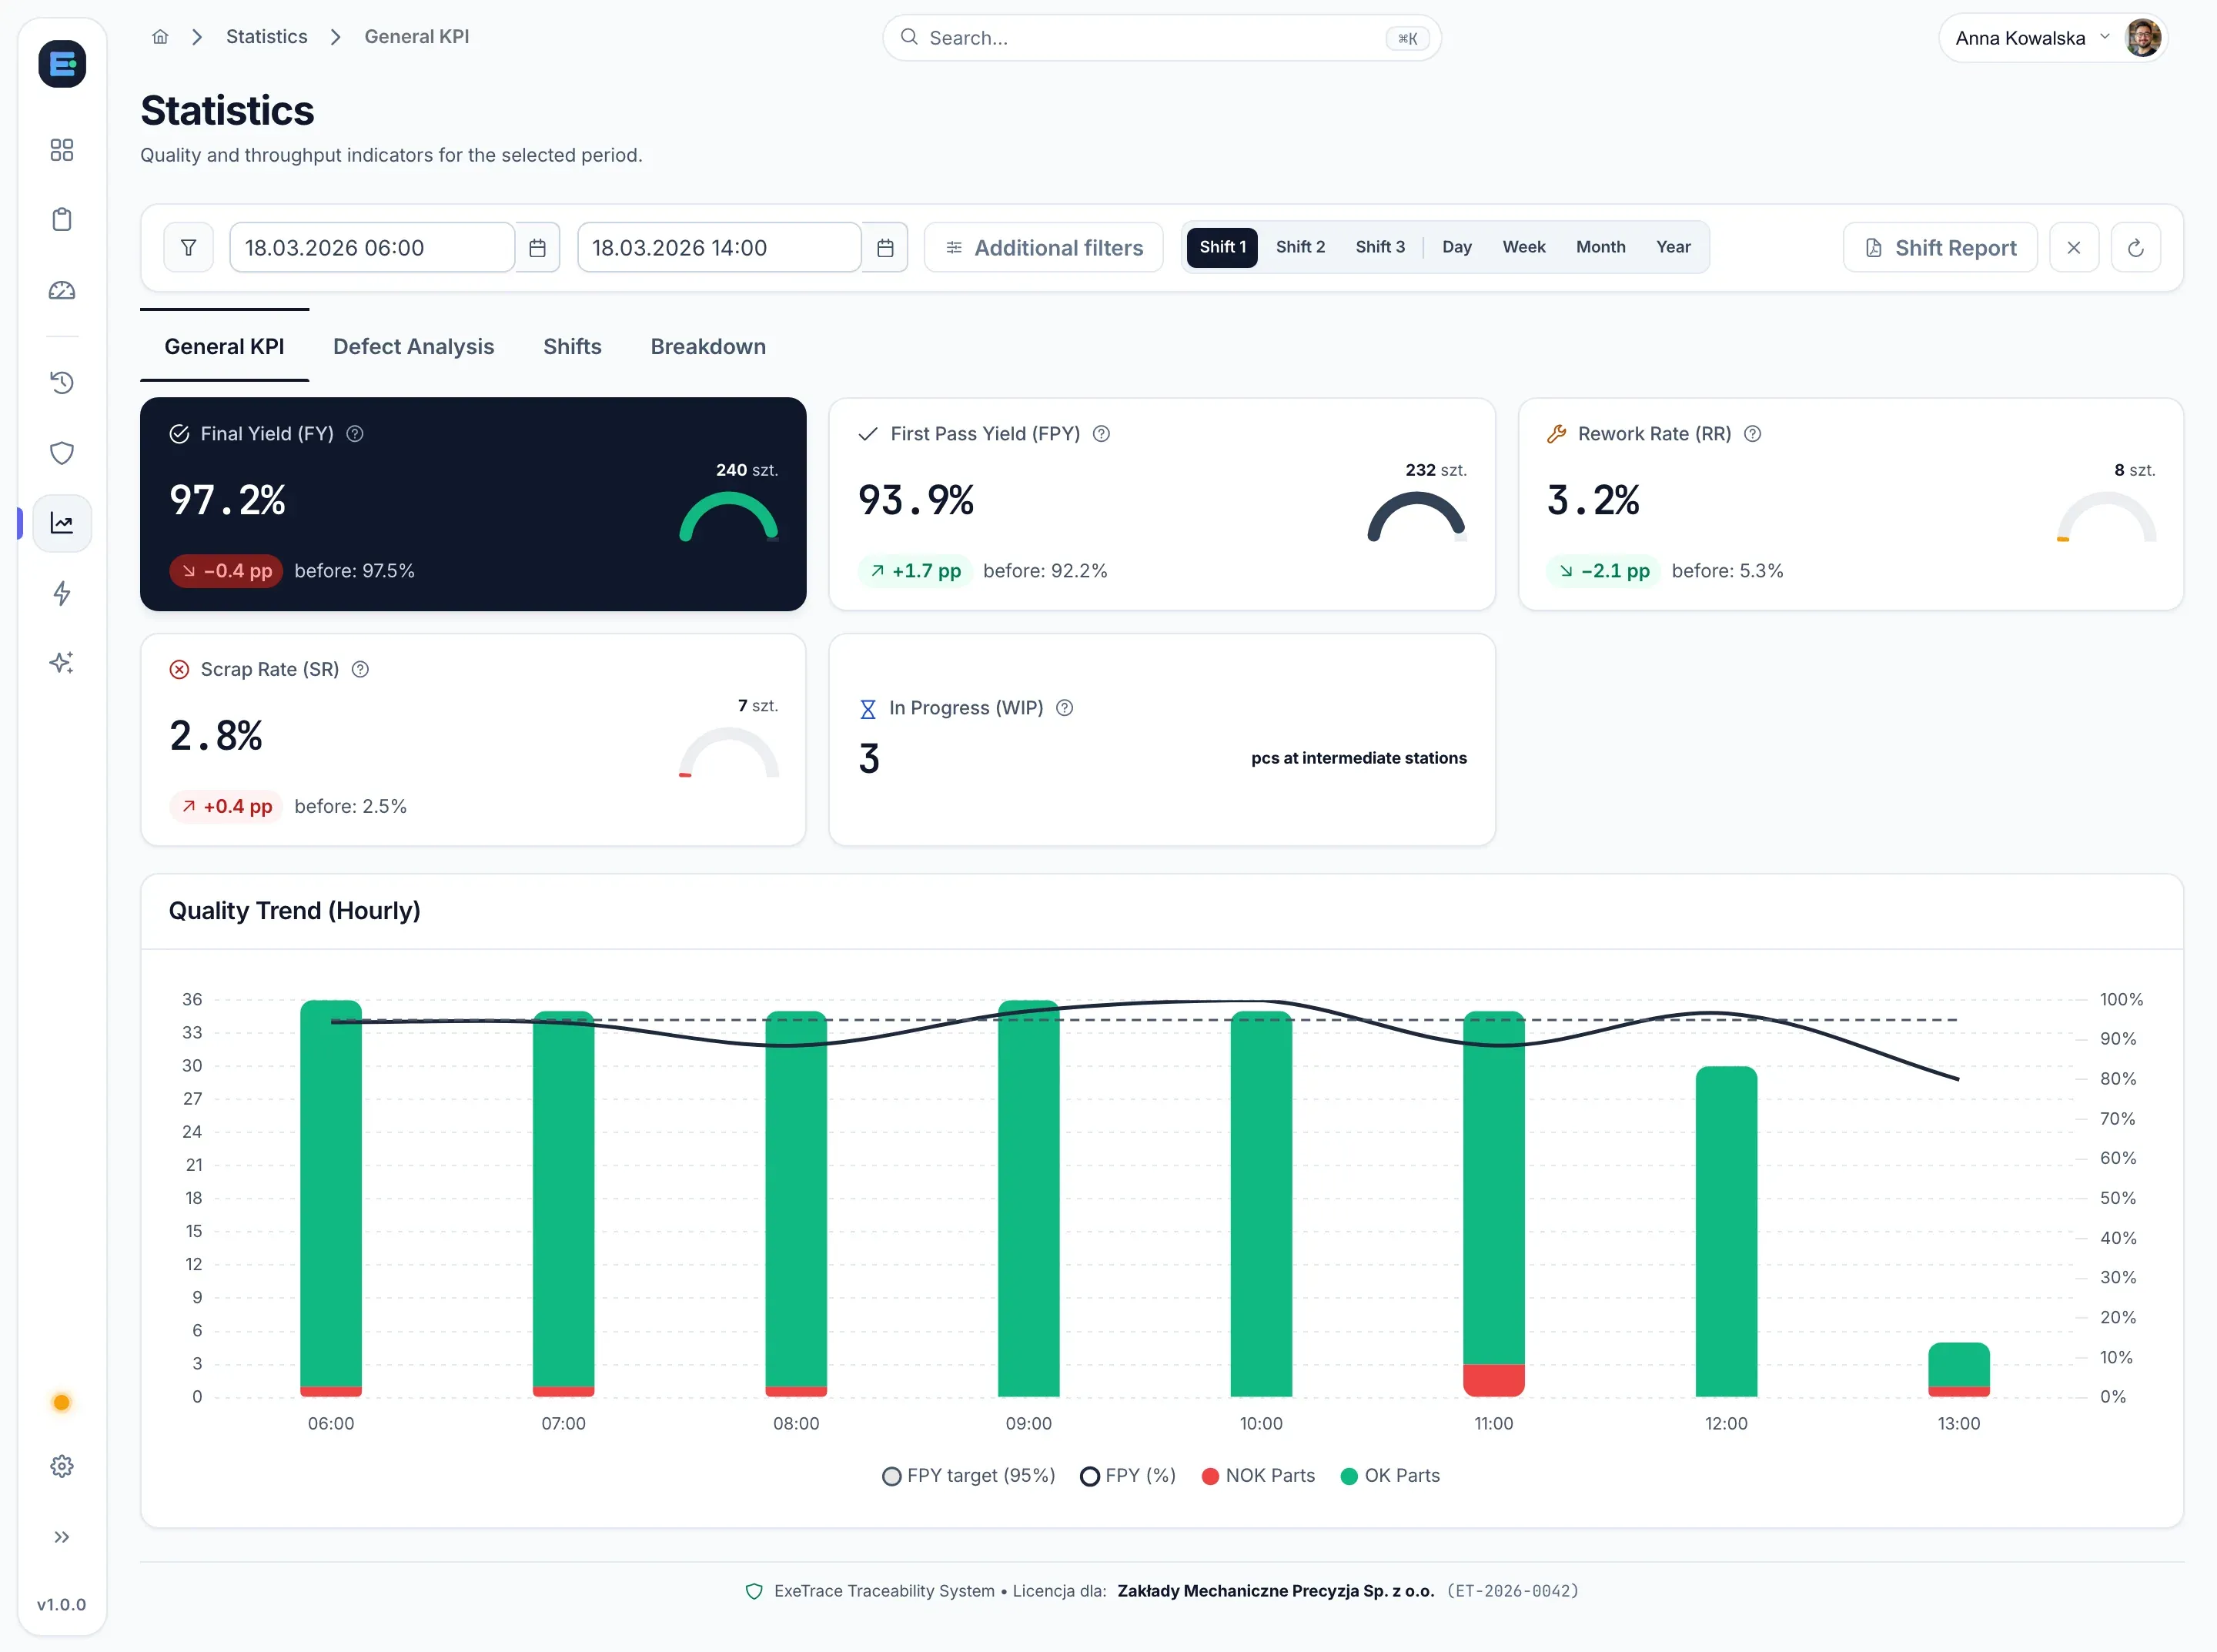
06 KPI indicators

How did the shift go? The answer is in one row of numbers.

Good units, FPY, rework and scrap, calculated with the same definitions as the reports and compared with the previous period. From the same screen you download the shift report as a PDF.

  • Good units, FPY, rework, scrap and WIP in one row
  • Every indicator compared with the previous period
  • Period in one click: shift 1–3, day, week, month or year
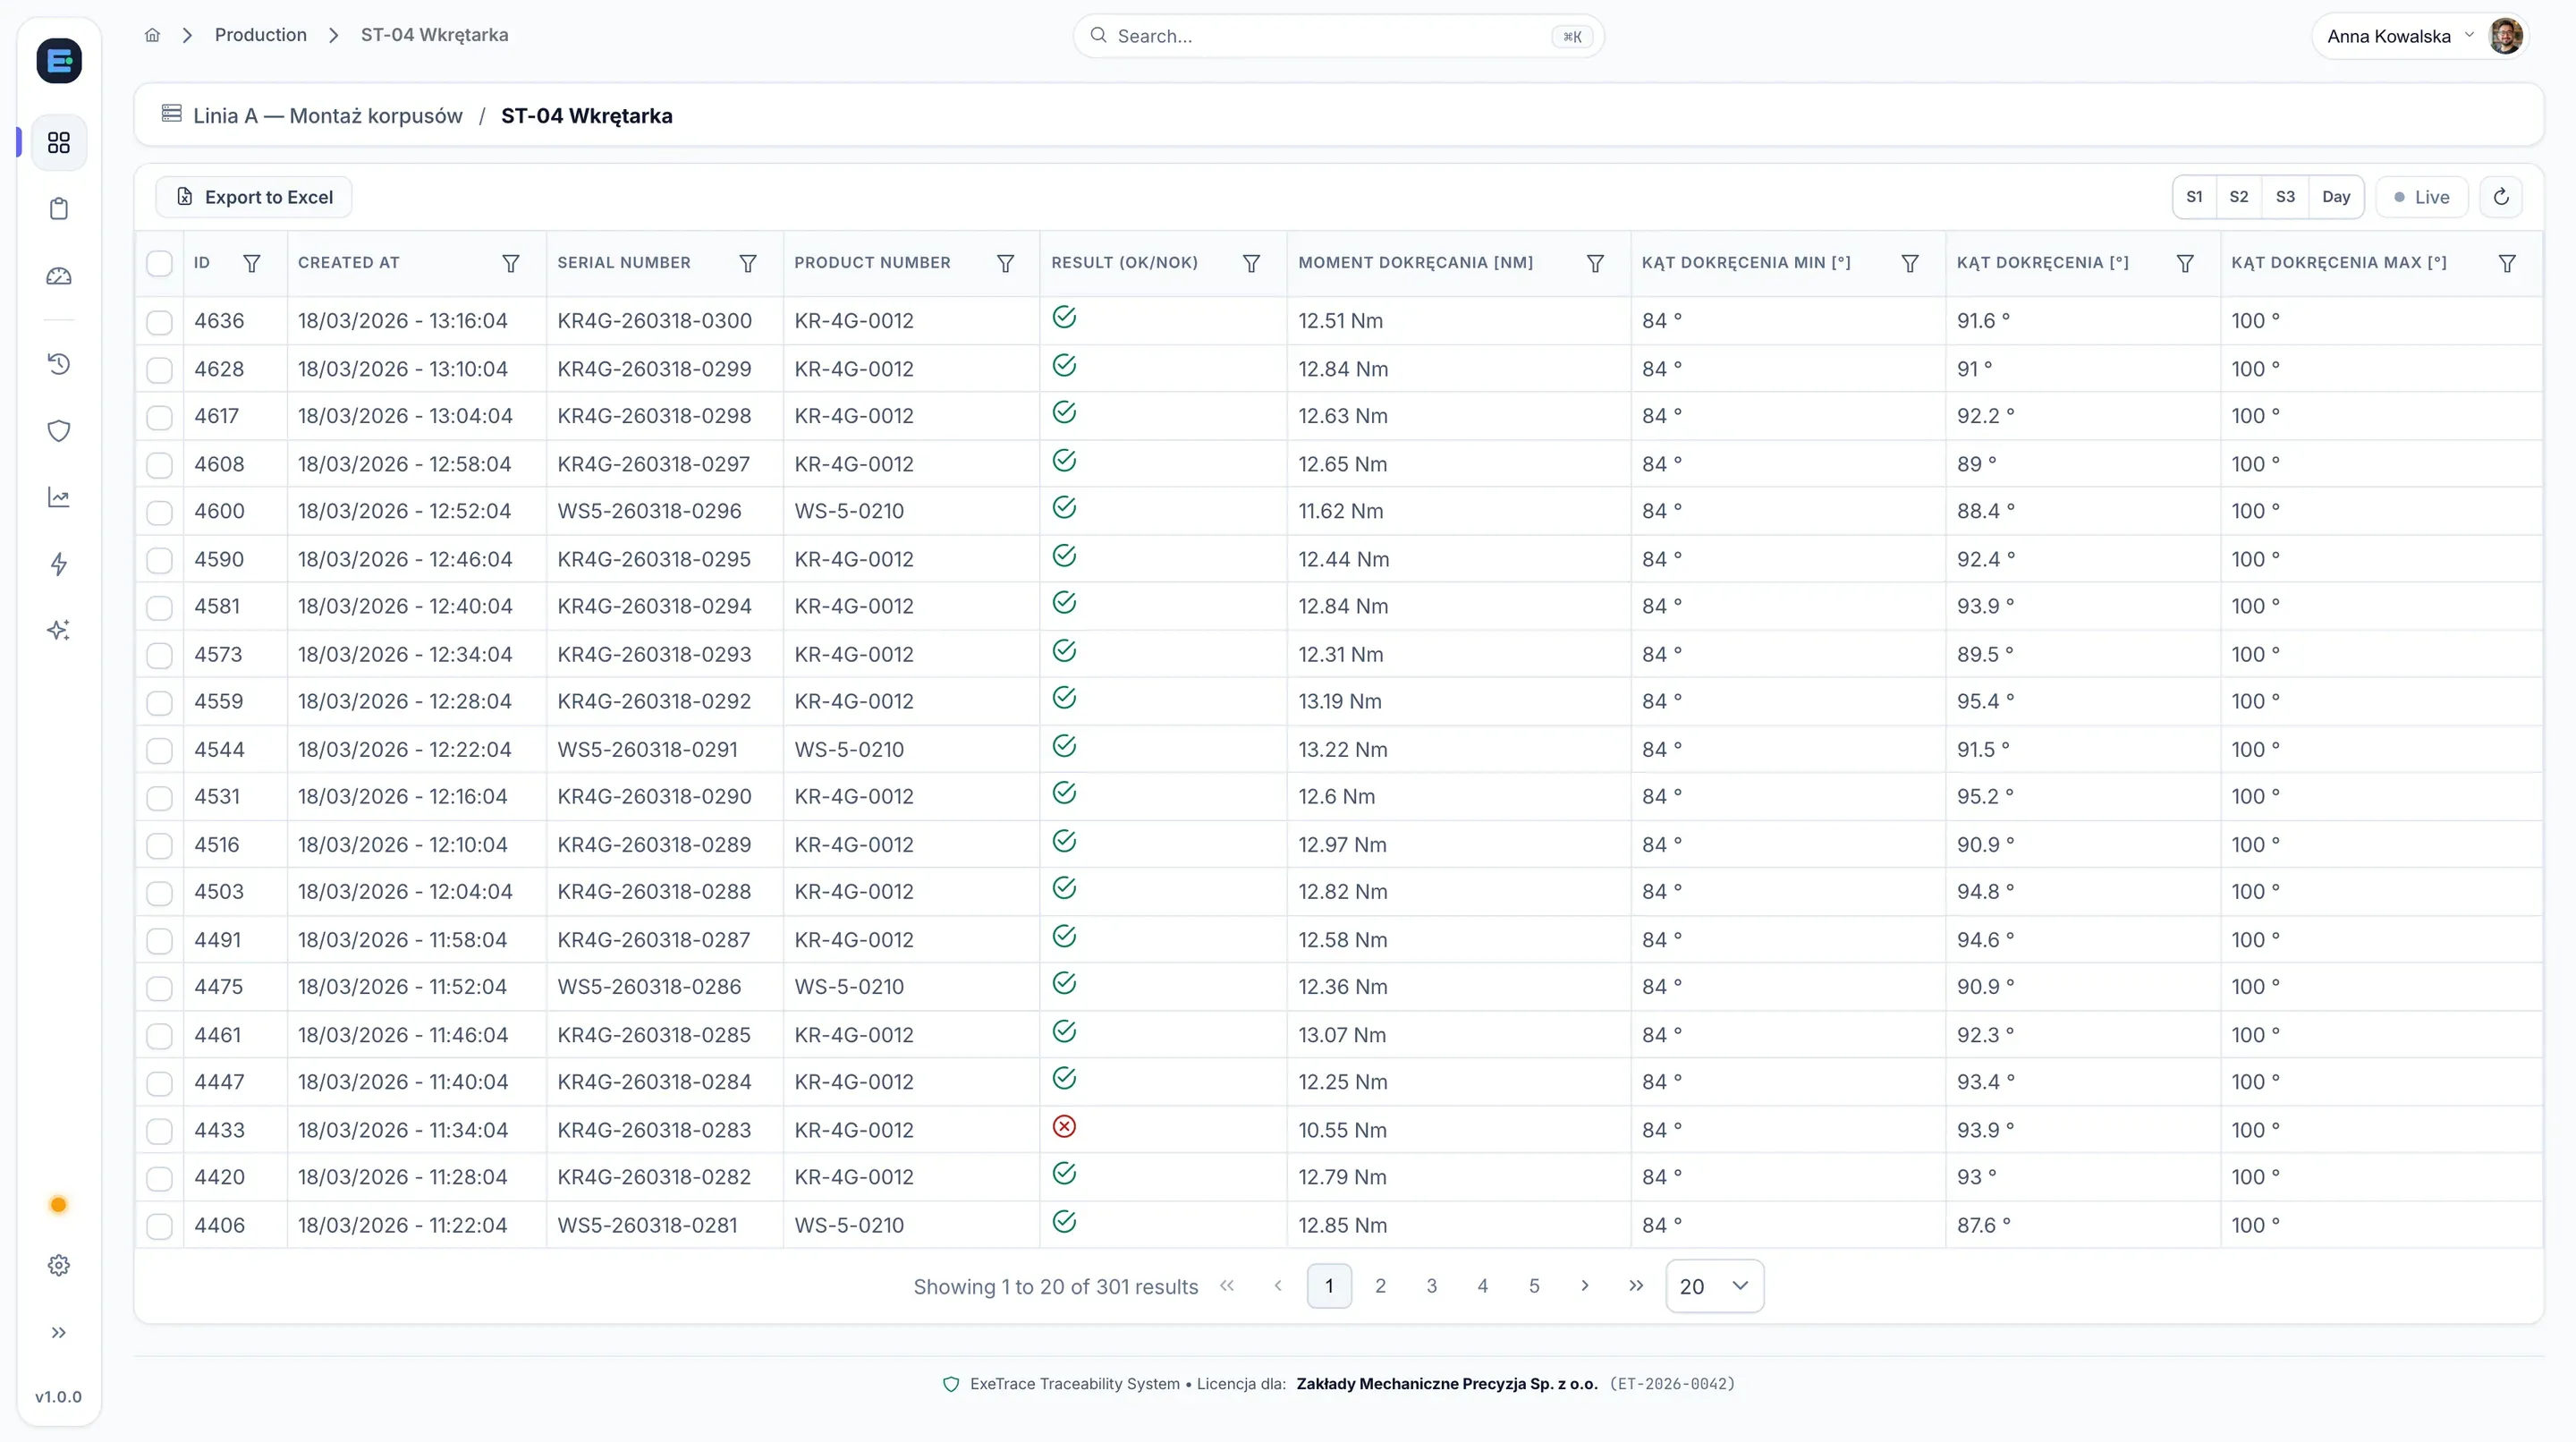
07 Machine logs

Every machine cycle stored in its own row.

Raw station logs: time, serial number, product number, OK/NOK result and the measured parameters. You filter them by any column and export to Excel when someone else needs them.

  • A filter in every column header and a choice of shift or day
  • Export to Excel with one button
  • Live view and paging — 301 results in the example
Reports

From screen to document in one click.

Shift close, process capability and the history of a single unit — ready-made PDF files you can pass on right away.

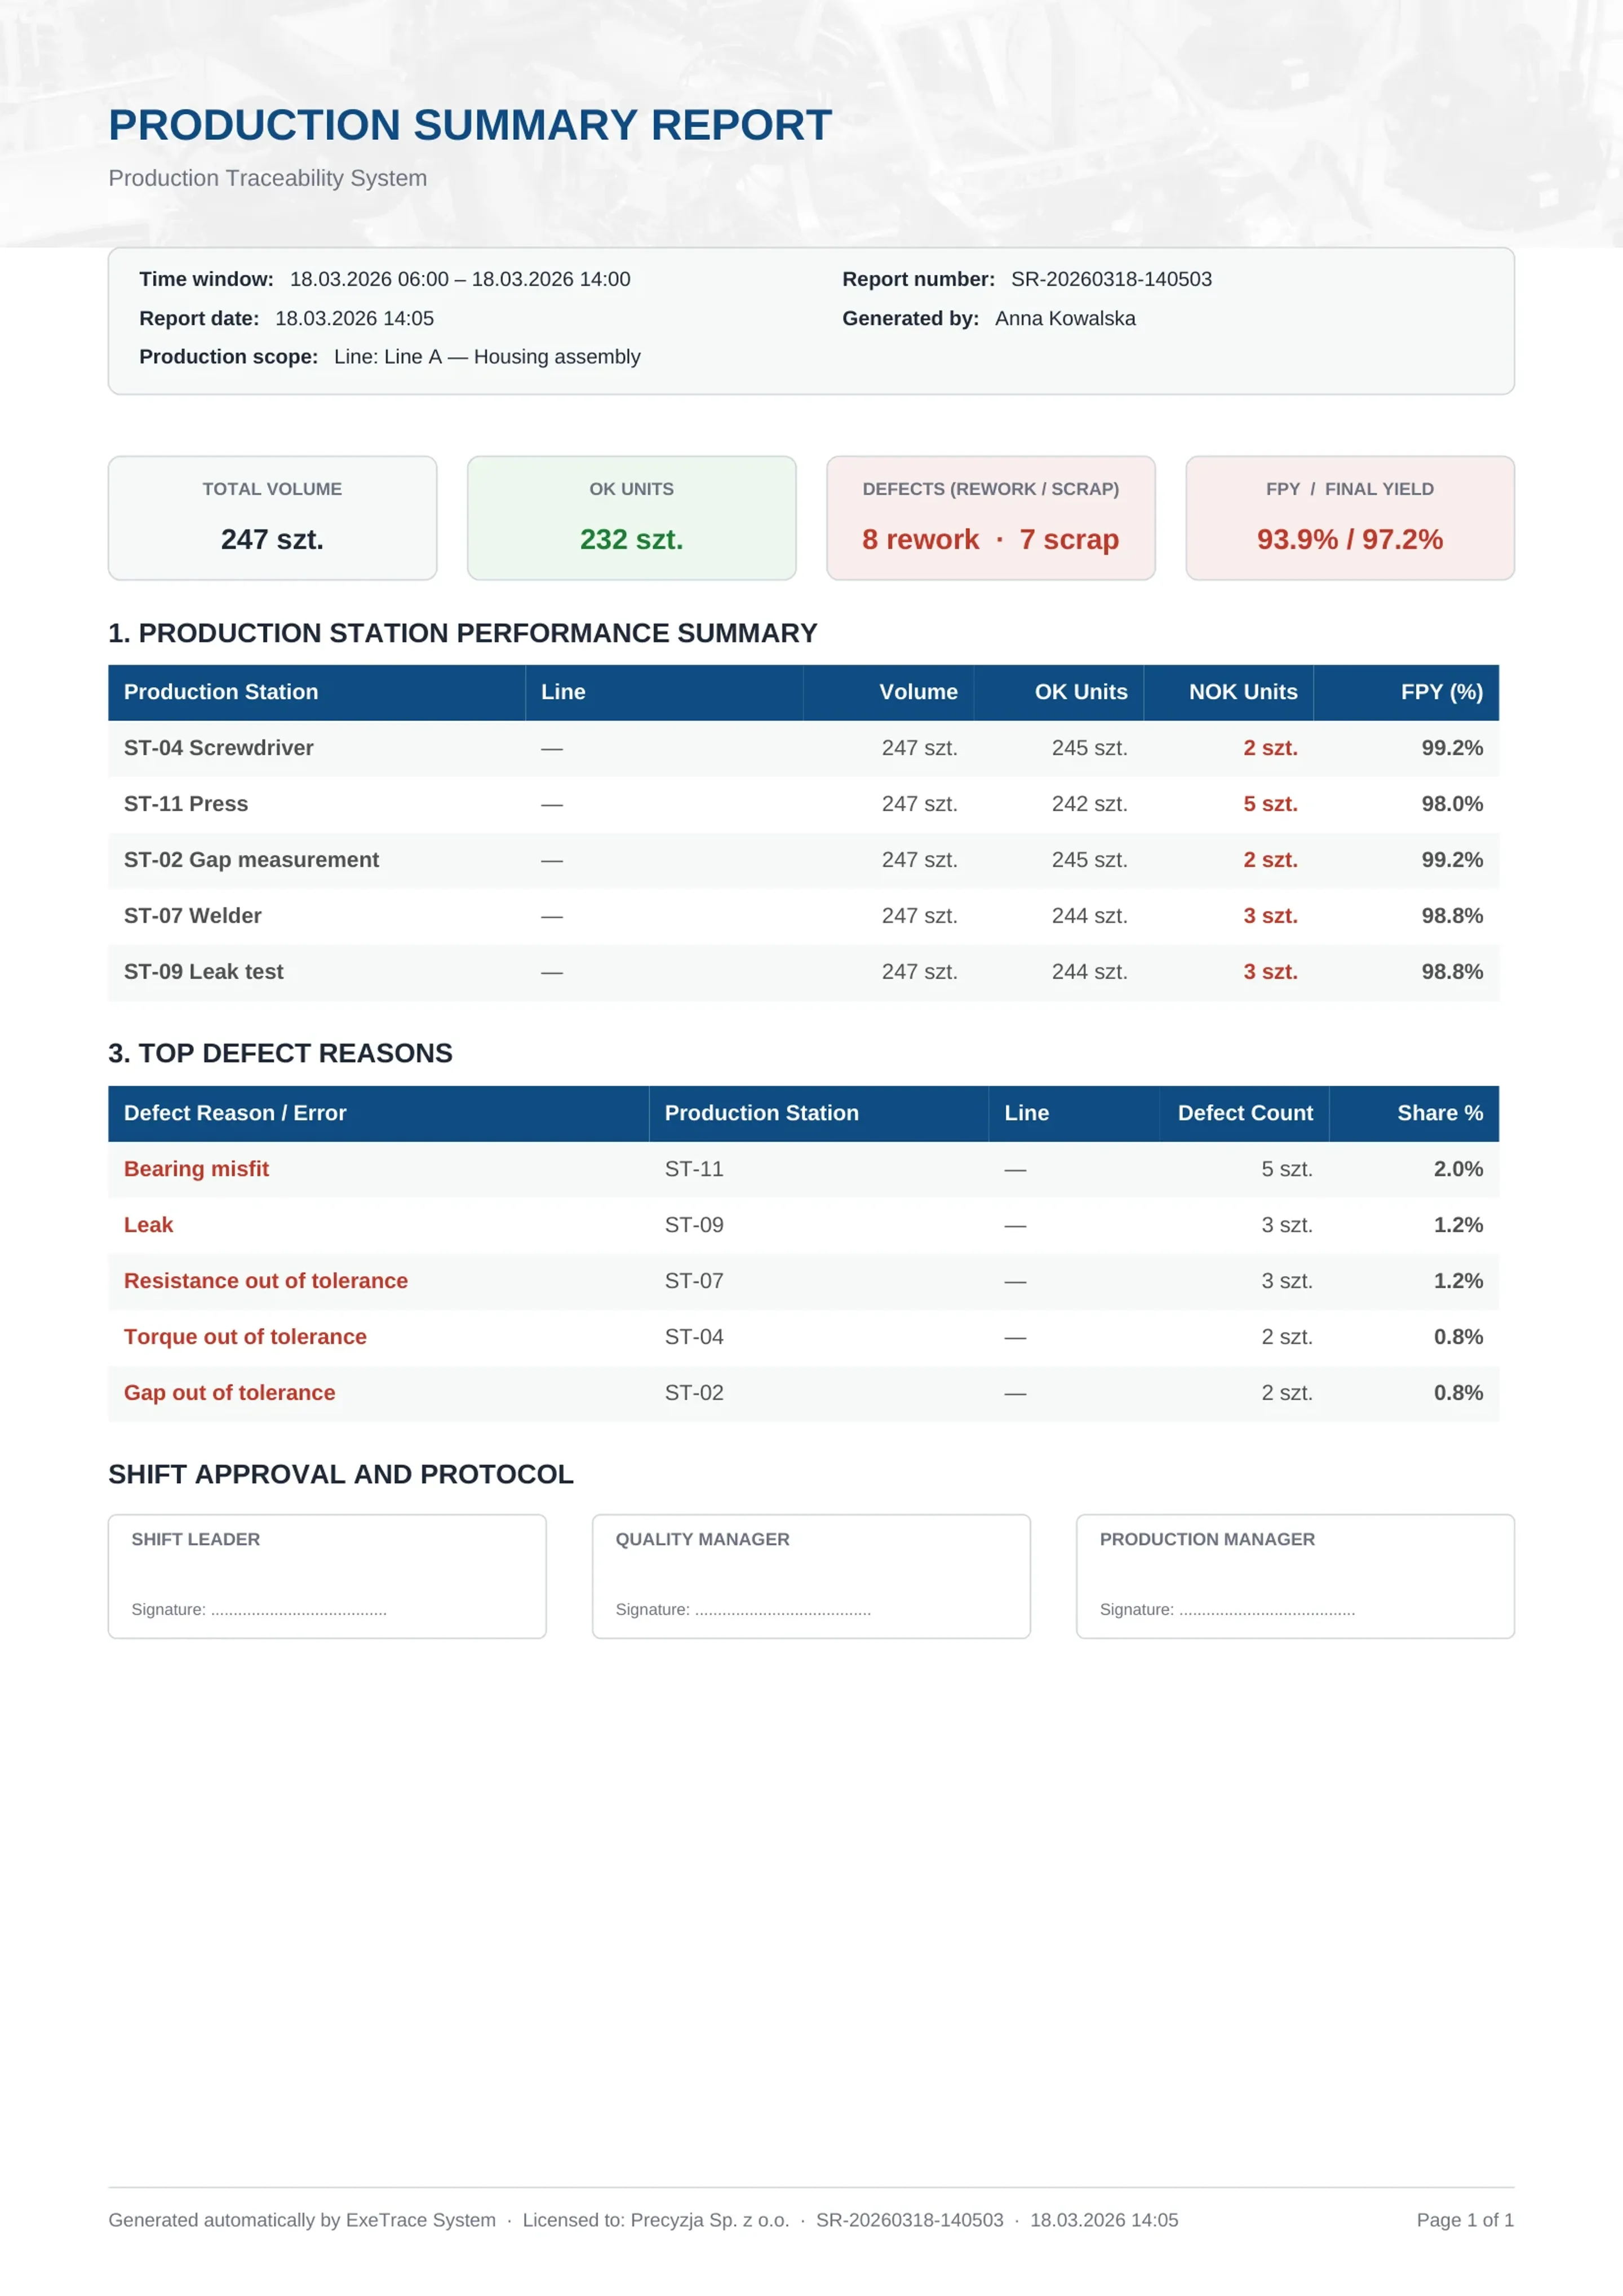
01 PDF reports

A shift report ready to sign, with no Excel assembly.

The shift close report gathers volume, FPY, station results and a Pareto of NOK causes, with room for signatures. The process capability report shows Cp, Cpk, Pp and Ppk plus control charts for each parameter. You download both from the dashboard in one click.

  • Narrow the scope to a line, a station or a product
  • Period: previous shift, day, week, month or the last few hours
  • Report in Polish or English
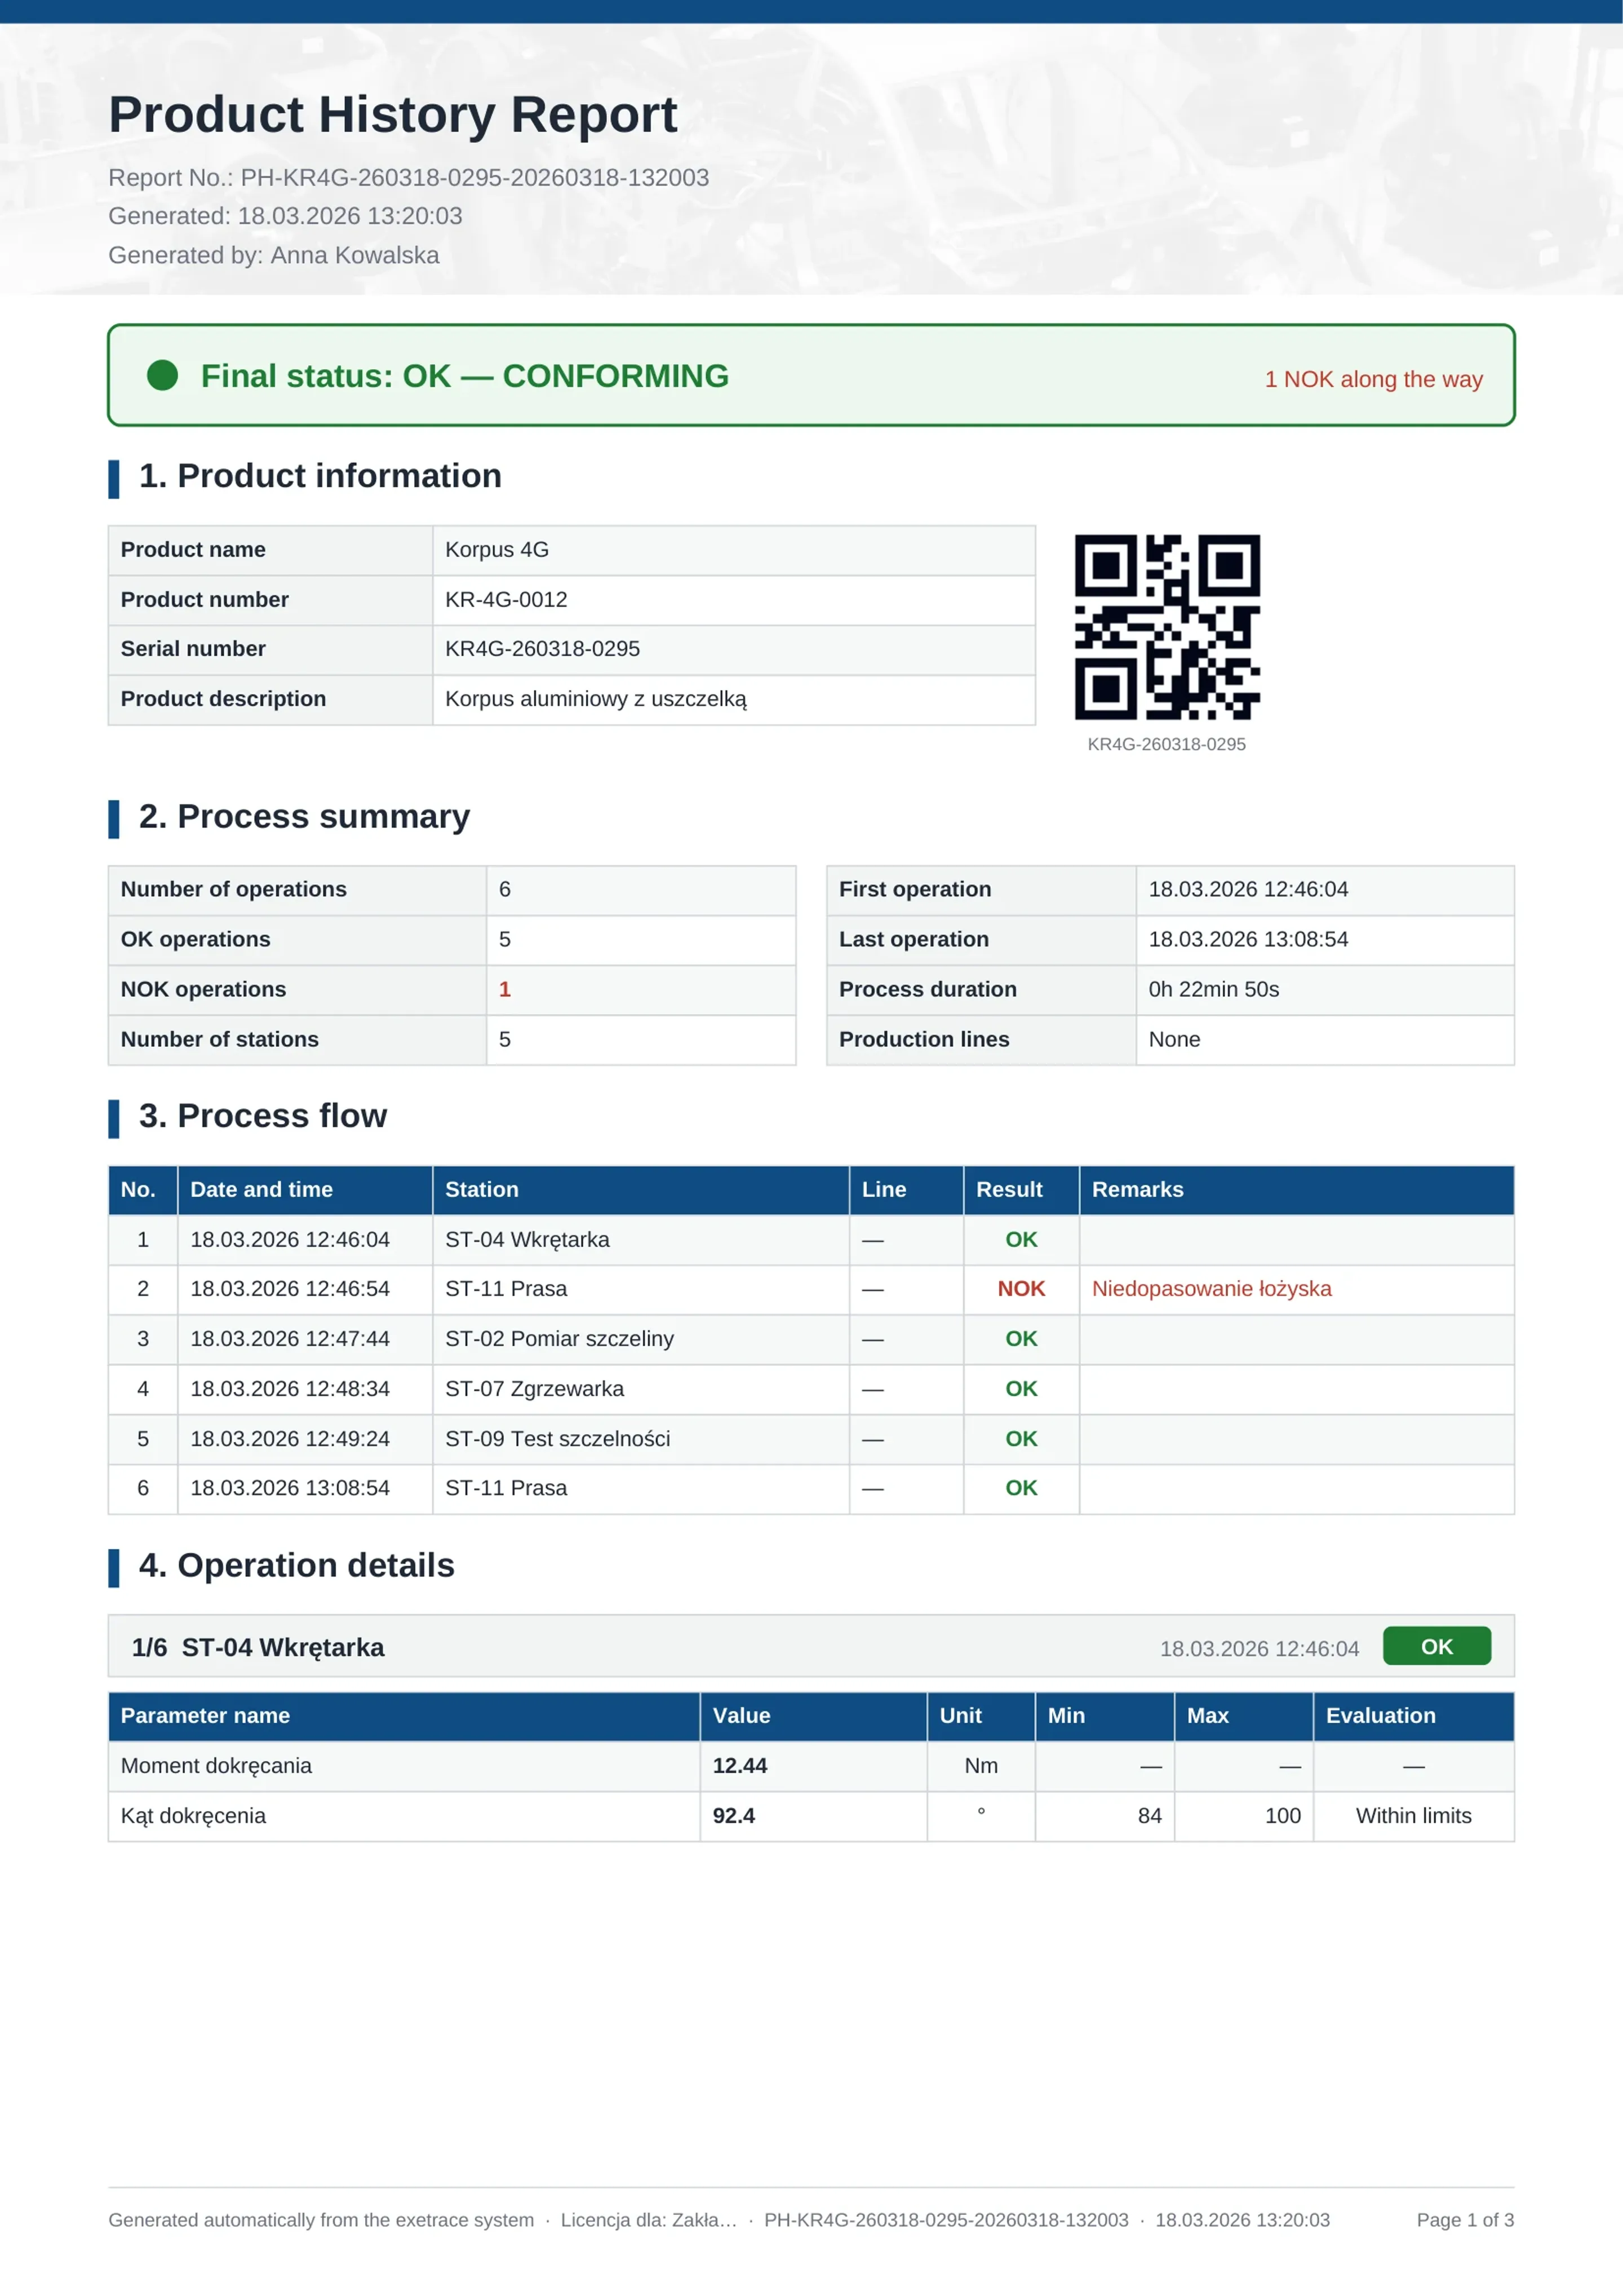
02 Unit report

A report on one specific unit — for the customer or for management.

Every product has a “PDF report” button. You get a document with the serial number and a QR code, the final status, the route through the stations, the parameters of every operation against their limits and the NOK causes. The file is ready to send to the customer or show to management.

  • Serial number, product number and QR code on the first page
  • Parameters of every operation rated against their limits
  • The same history you see on the unit passport screen
The bottom-line impact

Fewer losses, better decisions, lower risk.

Four things that change once the data from every station lands in one place.

See all production in one dashboard

Data from every station and line collected automatically — FPY, scrap and output, live.

See where money leaks

Know which station and product generate the most scrap — backed by numbers, not hunches.

Act before a process leaves tolerance

SPC charts and Cp/Cpk show drift before a defect appears.

Contain complaints to exact units

When a customer reports a defect, pull specific serial numbers instead of a whole batch.

Product genealogy

Complete links — in both directions

Enter the serial number of a defective component and see every product it was built into. And the other way round: open a product and see what it is made of.

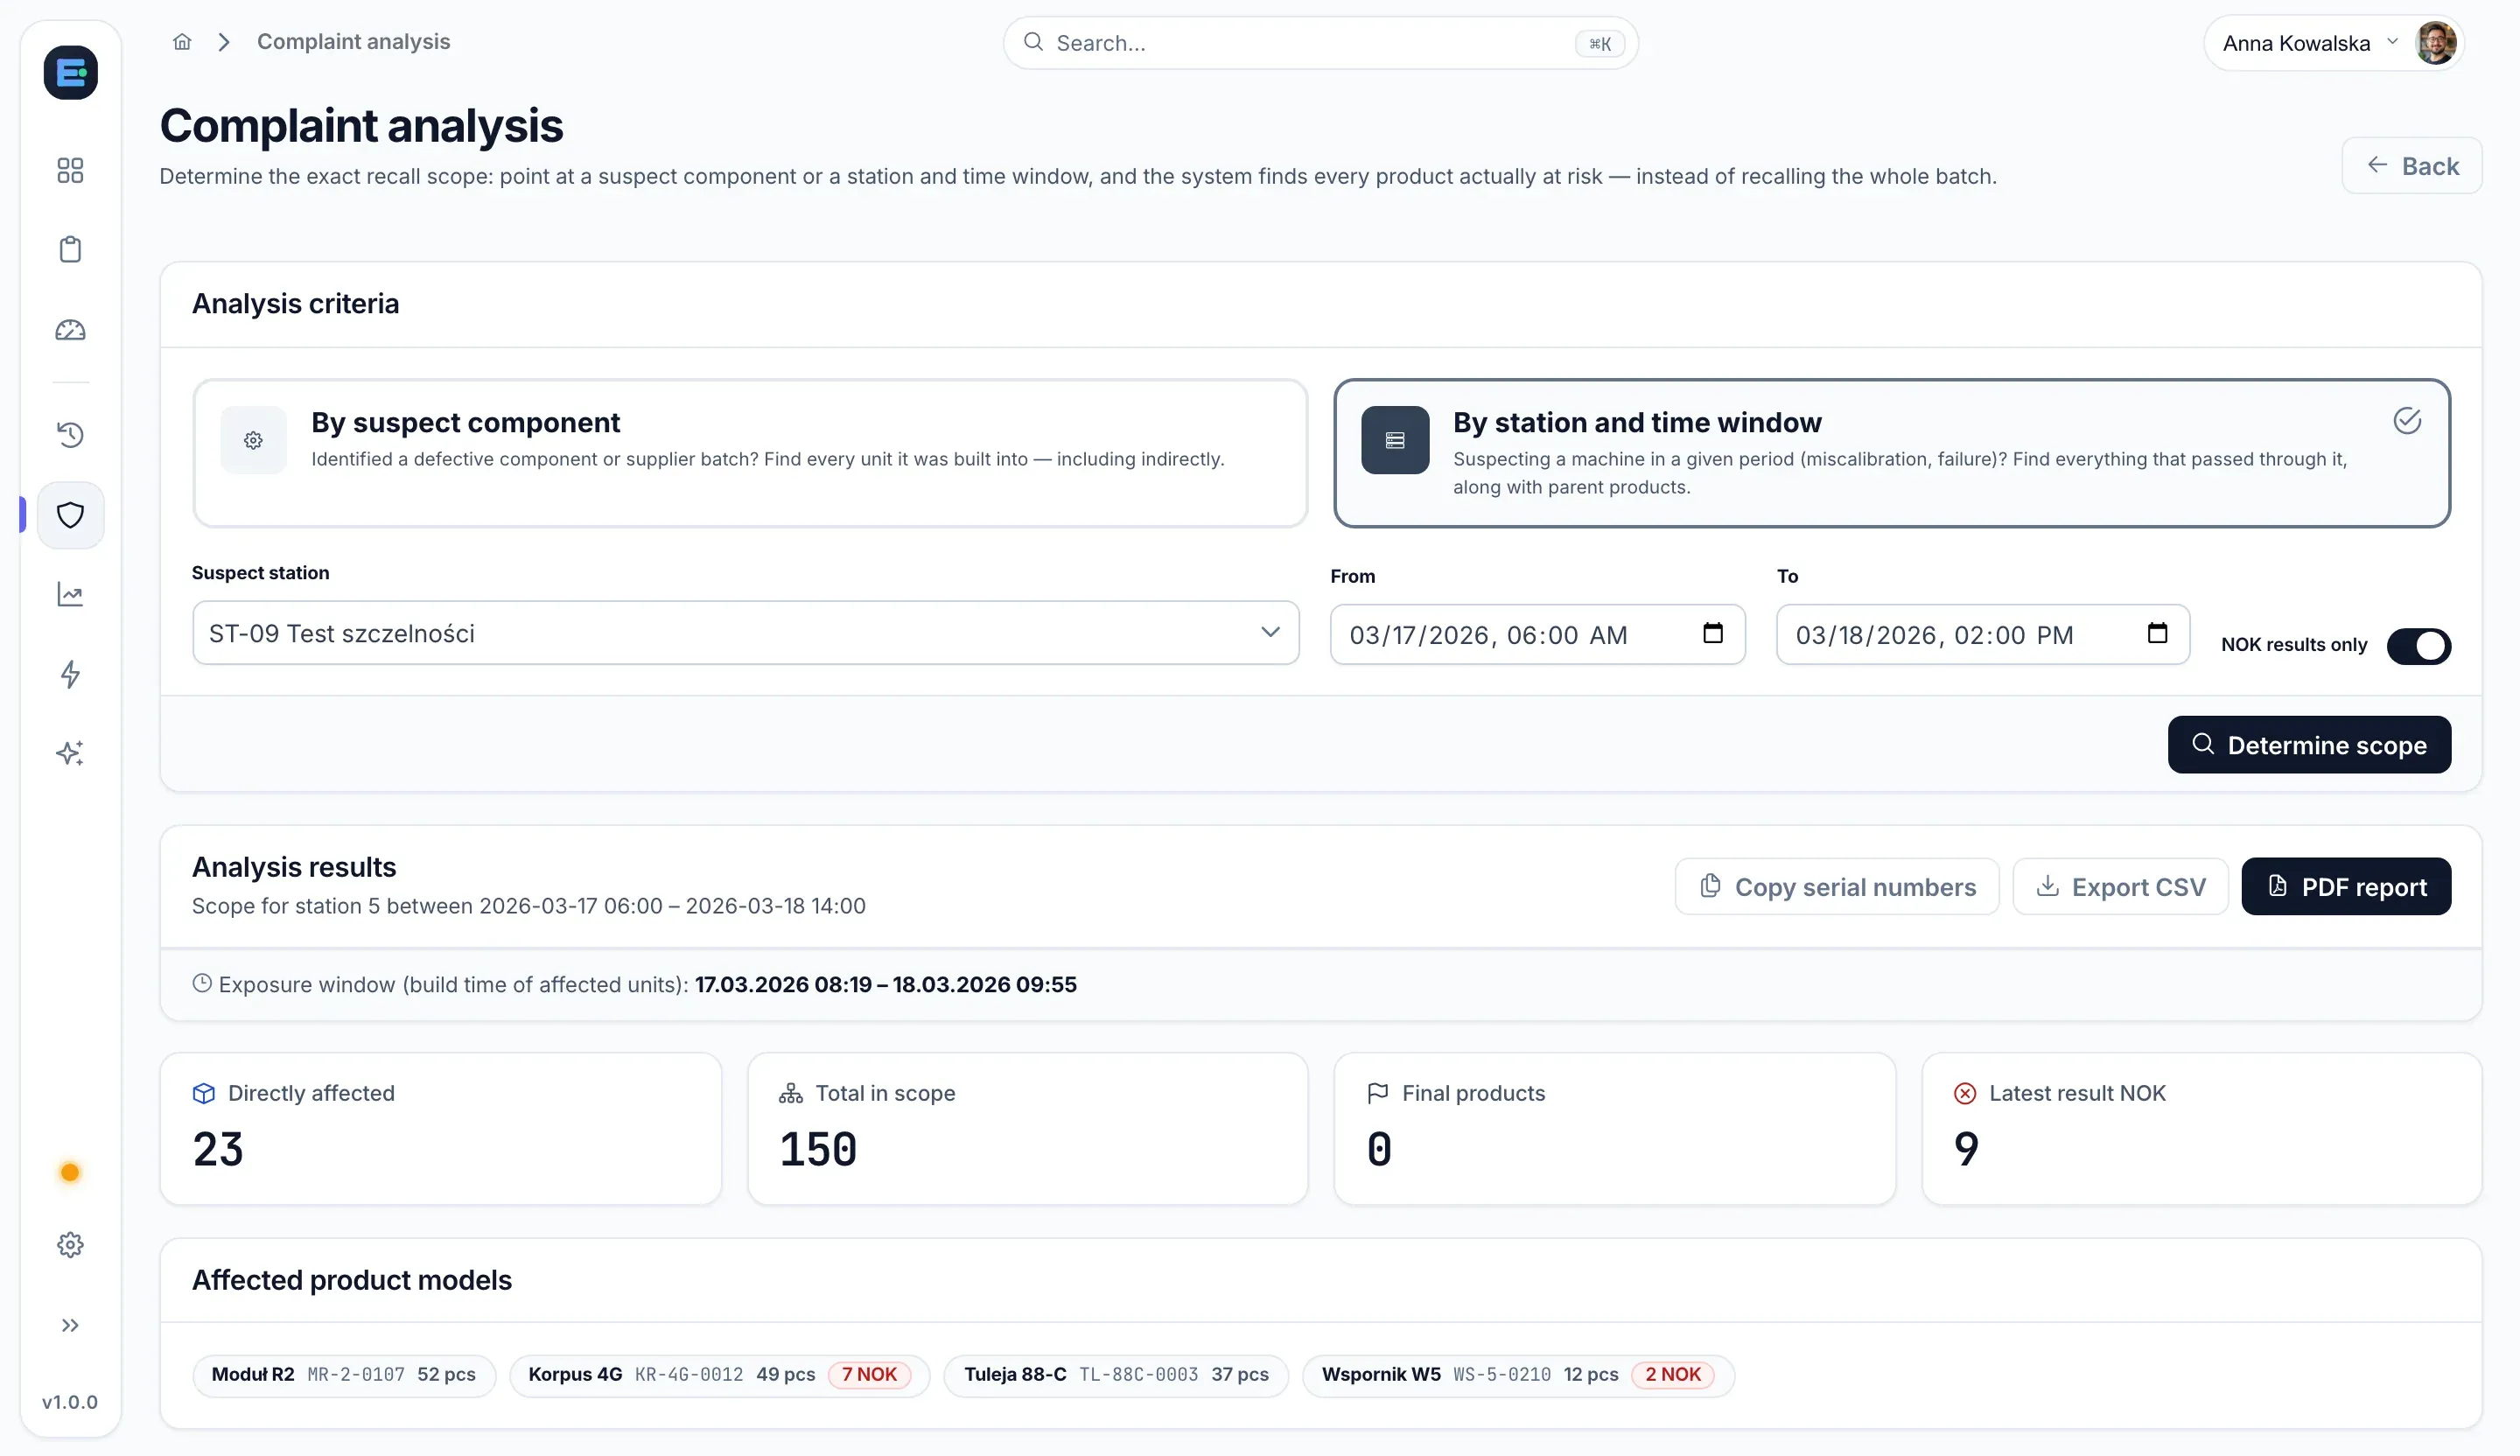
01 Complaint analysis

A complaint? You see the exact scope, not the whole batch.

You point to a defective component, or to a station and a time window. The system finds the products the component was built into — indirectly too, through parent products — and shows which have a last result of NOK. You copy the serial numbers, export them to CSV or download a PDF report.

  • Two modes: by component, or by station and time window
  • In the example: 23 units directly, 150 in scope, 9 with a last result of NOK
  • Copy serial numbers, export CSV and a PDF report
Production statistics

See straight away what and where is costing you

The system points straight to the stations and defect causes behind most of your scrap.

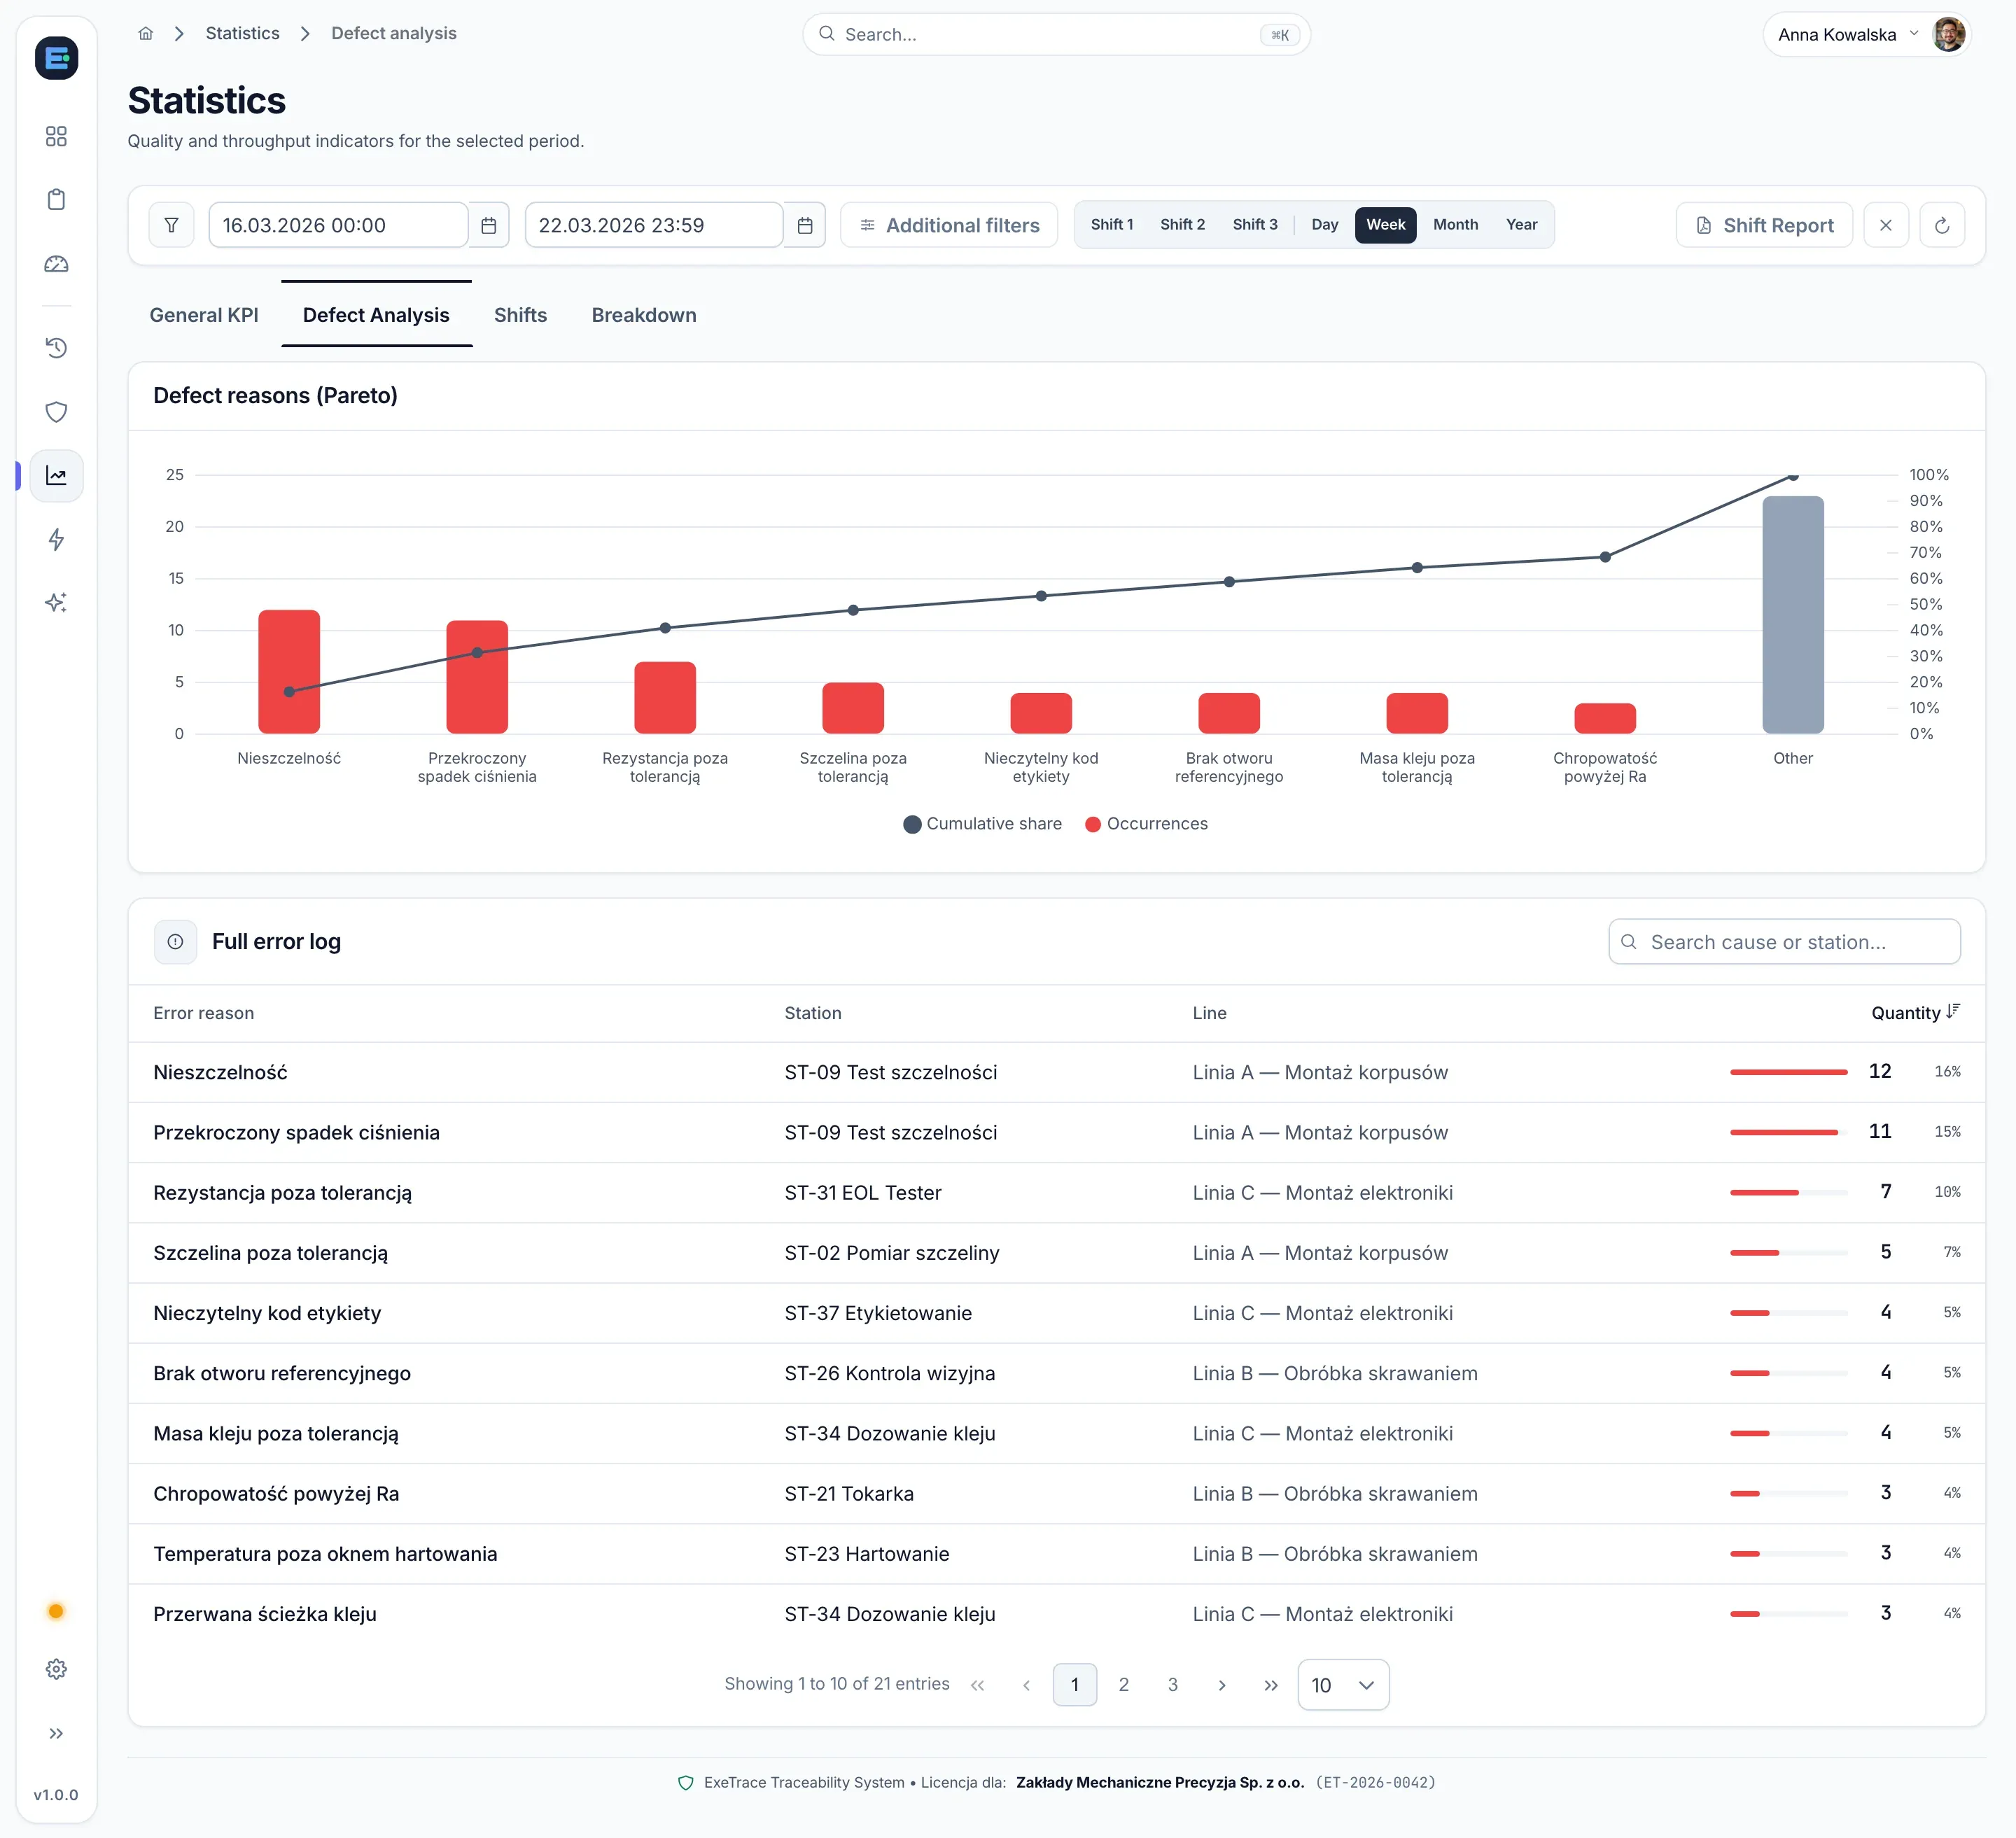
  • Pareto of defect causes

    Two causes on ST-09 drive 31% of the week’s scrap — the priority is clear.

  • Fault tied to station

    Every defect has an exact station, line and timestamp.

  • Shift report in PDF

    Shift summary ready to send in a single click.

The statistics screen in exeTrace: a Pareto chart of defect causes with a cumulative curve and a full error register with station, line and number of occurrences
Enlarge view
See it on your data

See your own production data in one dashboard.

30 minutes online — we show the system live and estimate what missing production data costs you today.

Work out the cost of a complaint on your own numbers
Live in days, not a six-month project

Running in days, not months.

Your own maintenance team brings it up — with ready-made PLC blocks and step-by-step documentation.

  1. Day 1

    Server on your network

    Start the Docker images — infrastructure is up within hours.

  2. Day 2

    Machines connected

    Your controls engineer imports ready blocks into TIA Portal — no outside integrators.

  3. Day 3

    Live data flowing

    See unit passports, scrap Pareto and bottlenecks.

New parameter or machine? Add it yourself — no vendor PO.

Update configuration in the panel with no rebuild and no line downtime.

Pricing

Public prices. No “ask for a quote”.

Buy the licences once — they are yours for good. Add support only if you want it.

Required

PLN 30,000

one-off · net

Server licence

Required × number of machines

PLN 8,000

per station · one-off · net

Station licence

Optional

20% / year

of licence value · net

Support and updates

Prices are net. For larger deployments we will prepare an offer matched to the scope.

Questions

The questions decision-makers ask

Got a different question? We reply within 24 hours — by phone or email.

When does the system pay for itself?

When you stop losing time to manual reports and find scrap causes faster — and on a complaint you recall only the units at risk.

Do we need an external integrator to deploy it?

No. Your own maintenance team brings it up using our step-by-step docs and remote support.

How fast will we see the first data?

1–3 working days from spinning up the server to the first station records.

What if we add machines or parameters later?

You add them yourself in the configuration — no vendor PO and no downtime.

Does production data leave the plant?

No. Everything runs on-premise on your internal network — zero cloud.

What changes for machine operators?

Nothing. Data is collected automatically from the PLC in the background.

Does it include SPC (Cp, Cpk)?

Yes — live I-MR charts, Cp/Cpk/Pp/Ppk and Nelson rules, with CSV export.

Which PLCs are supported?

Ready blocks ship for Siemens S7-300, S7-1200 and S7-1500. Other controllers on request.

Free walkthrough

See exeTrace on data from your own production.

30 minutes online on your scenario — we show the system live and work out a quote.

What happens next

  1. 1 We reply within 24 hours and agree a time
  2. 2 30 minutes online: a demo on a scenario from your production
  3. 3 You get an initial quote for your number of stations

No commitment and no hard selling.

Prefer to talk?
Bartłomiej Filipiak EXECODE · industrial automation

Book a slot

We reply within 24 hours

Book a demo Call